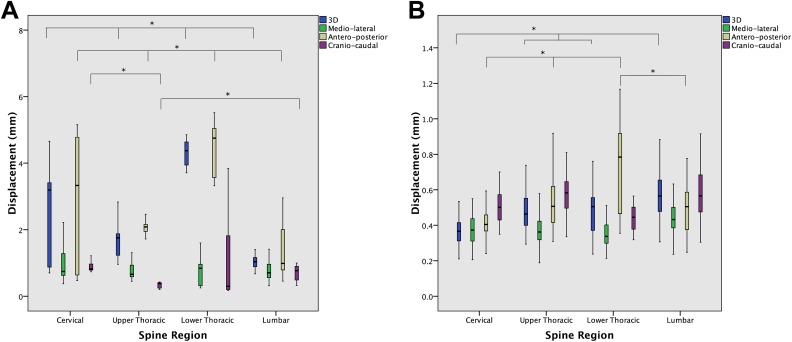
Figure 5.
Standard boxplots demonstrating absolute (A) and relative (B) respiration-induced vertebral motion, in 3 dimensions (3D) and in each of the mediolateral (ML), anteroposterior (AP), and craniocaudal (CC) axes, stratified by spinal region. Boxes represent the first quartile, median, and third quartile. Whiskers represent 1.5× the interquartile range. *Represents significant difference, at P < .05.

