Fig. 2.

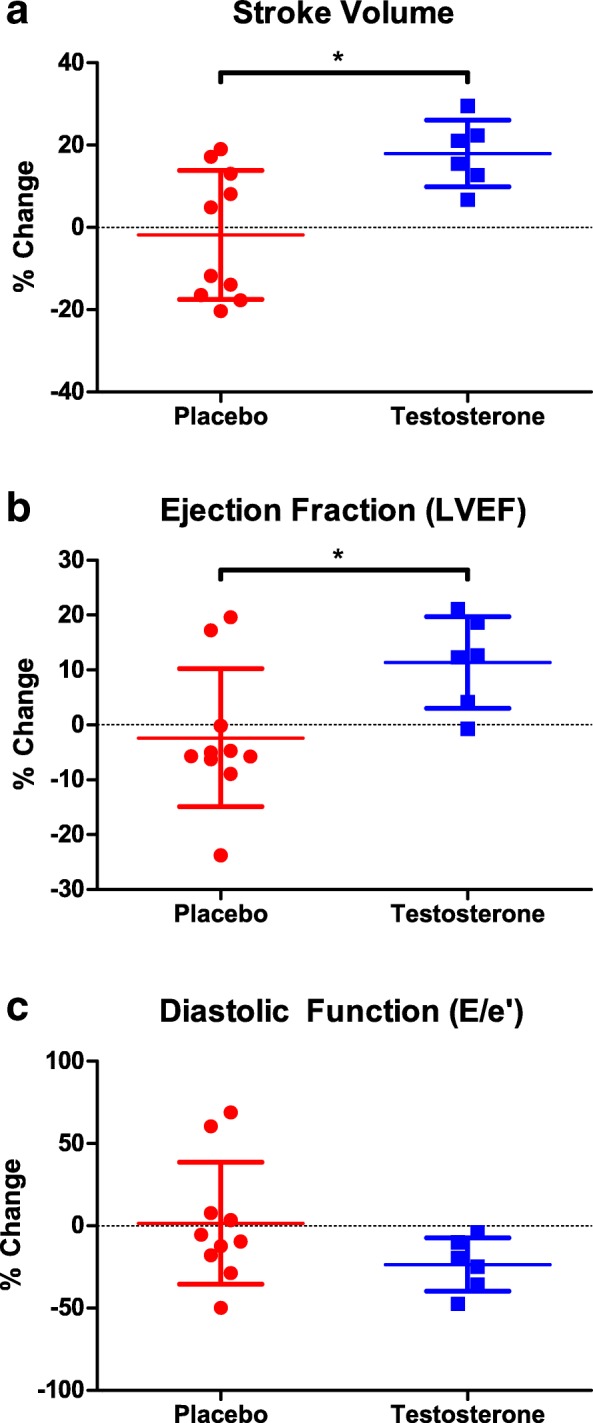
Percent change in stroke volume (a) left ventricular ejection fraction (b), and E/E’ (c) from pre to post-intervention in placebo (red) and testosterone (blue)

Percent change in stroke volume (a) left ventricular ejection fraction (b), and E/E’ (c) from pre to post-intervention in placebo (red) and testosterone (blue)