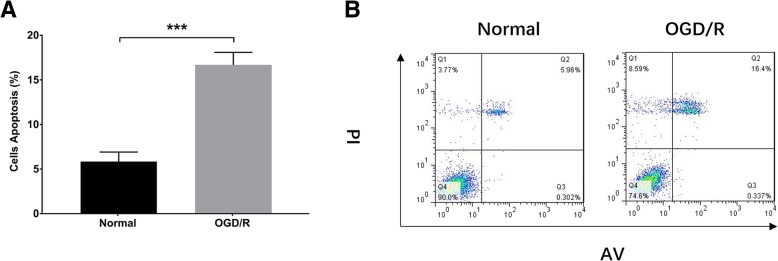
Fig. 1.
Cell apoptosis rate in OGD/R group and normal group. Cell apoptosis rate was elevated in OGD/R group compared to normal group (a-b). Comparison between two groups was assessed by t test. OGD/R, oxygen and glucose deprivation followed by reperfusion. P < 0.05 was considered significant. ***P < 0.001

