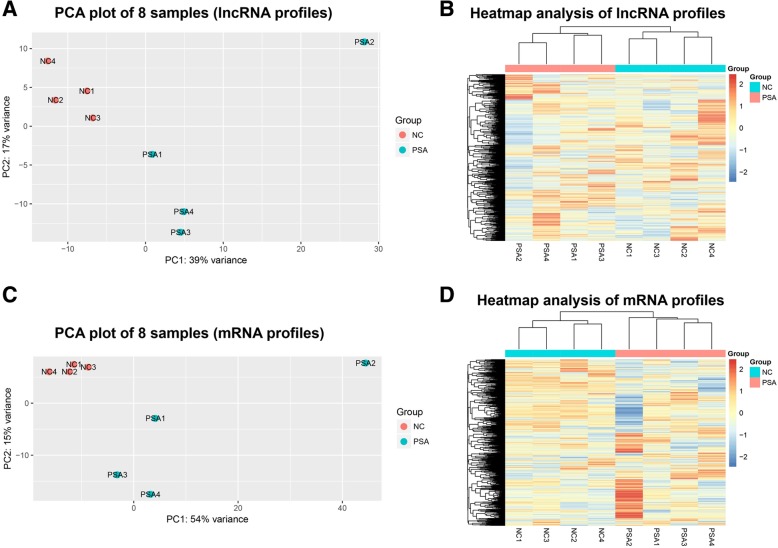
Fig. 2.
PCA plot and heatmap analysis. PCA plot showed a clear separation between 4 PSA patients and 4 NCs by lncRNA profiles (a). The heatmap analysis of lncRNA profiles revealed that lncRNA profiles could differentiate PSA patients from NCs (b). PCA plot (c) and heatmap analysis (d) of mRNAs profiles disclosed that mRNA profiles also clearly segregated PSA patients from NCs. PCA, principal component analysis; PSA Psoriatic arthritis, NCs Normal controls, LncRNA Long non-coding RNA

