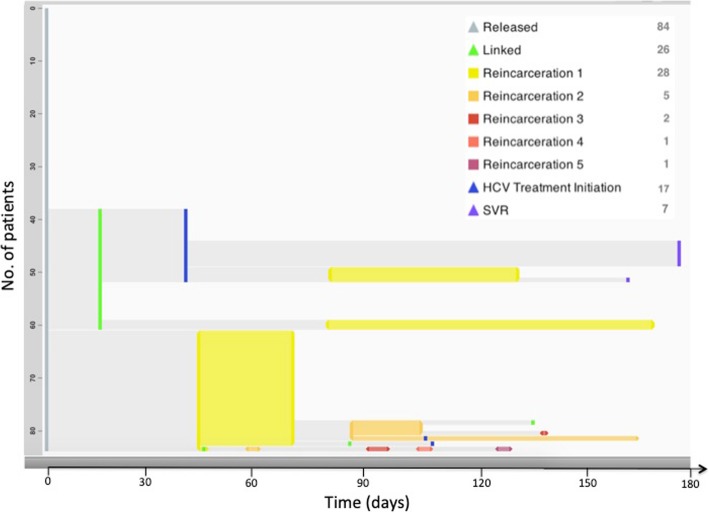
Fig. 3.
Trajectories of people living with HCV after incarceration in the New York City Jails. Each row in an EventFlow figure represents one participant’s sequence of events during a period of time. The height of each bar is proportional to the number of records with that sequence, and its horizontal position is determined by the median time between events. Groups of sequences with the same preceding event are sorted by the number of records in each group. The sequence groups are shown from top to bottom in descending order of number of participants per group. For interval events such as returns to jail, the length of the intervals represents the mean duration of the grouped events. For point events such as linkage to HCV care, periods between the aggregated point events represent the mean length of time from any previous point event

