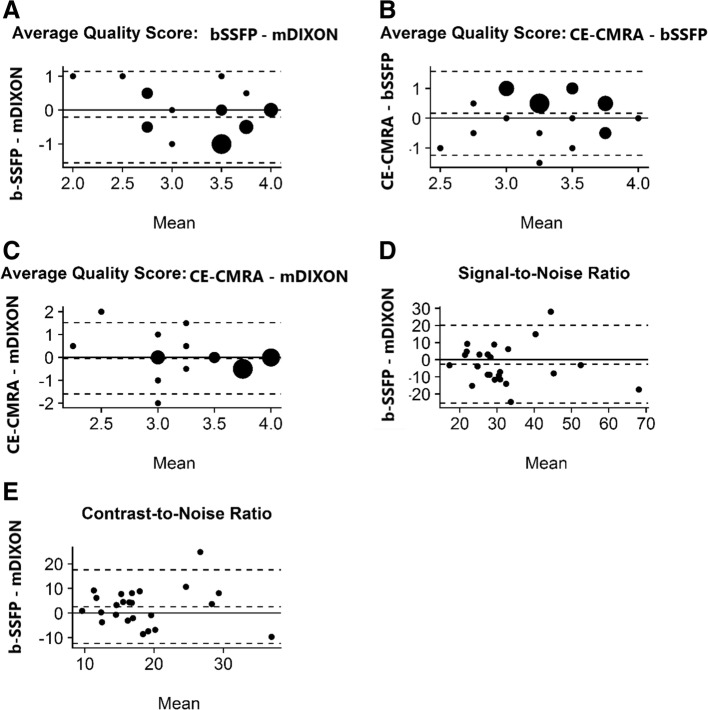
Fig. 1.
Bland-Altman Plots for Image Quality Scores between Balanced Steady State Free Precession (bSSFP)-modified Dixon (mDixon) (a), Contrast Enhanced (CE)-Cardiovascular Magnetic Resonance Angiography (CMRA)-bSSFP (b), CE-CMRA-mDixon (c); Signal-to-Noise Ratio (SNR) (d) and Contrast-to-Noise Ratio (CNR) (e) between bSSFP-mDixon. The y-axis provides the difference of the paired measures. The x-axis provides the mean of the paired measures. The dotted lines provide the mean difference and the 95% limits of agreement

