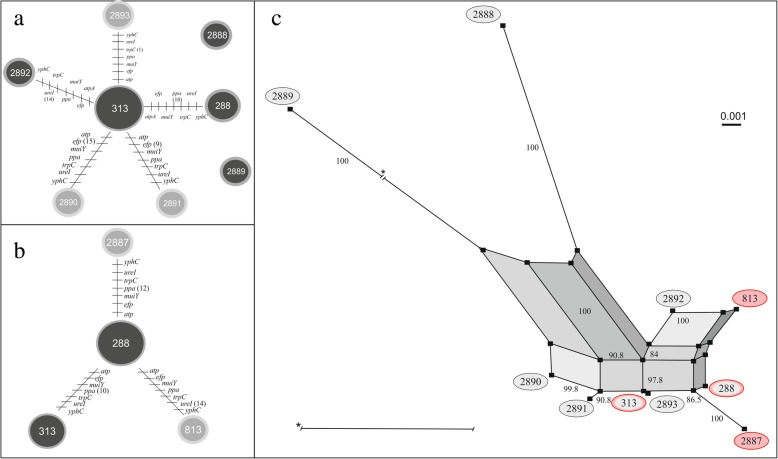
Fig. 1.
Evolutionary history among the STs of Helicobacter pylori identified in patient one with recurrent infection. a and b show the clonal relationships among the STs of H. pylori during the first and second infection events, respectively. Each line represents a different allele with mutational changes. PHYLOViZ (goeBURST algorithm) was used to define the clonal relationships [25]. a The main clonal complex in the first event was ST313 (12 strains), with five linked STs and two unlinked STs. b The main clonal complex in the second event was ST288 (15 strains), with three STs. c) Evolutionary relationships among the STs of H. pylori during both events. The neighbour-net graph defines the evolutionary relationships [26]; the black circles indicate the STs identified during the first infection event, and the red circles indicate the STs identified during the second infection event. Bootstrap values > 84% are indicated on the paths in the network. The highly branched network structure is indicative of possible recombination events among the STs

