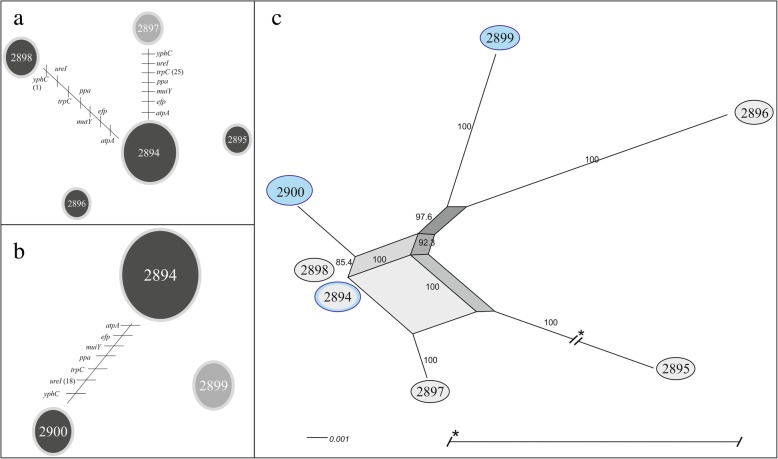
Fig. 2.
Evolutionary history among the STs of Helicobacter pylori identified in patient two with recurrent infection. a and b show the clonal relationships among the STs of H. pylori during the first and second infection events, respectively. Each line represents a different allele with mutational changes. PHYLOViZ (goeBURST algorithm) was used to define the clonal relationships [25]. a The main clonal complex in the first event was ST2894 (14 strains), with two linked STs and two unlinked STs. b The main clonal complexes in the second event were again ST2894 (18 strains), with only one ST, as well as ST2899, which was unlinked. c) Evolutionary relationships among the STs of H. pylori during both events. The neighbour-net graph defines the evolutionary relationships [26]; the black circles indicate the STs identified during the first infection event, and the blue circles indicate the STs identified during the second infection event. Bootstrap values > 85% are indicated on the paths in the network. The highly branched network structure is indicative of possible recombination events among the STs

