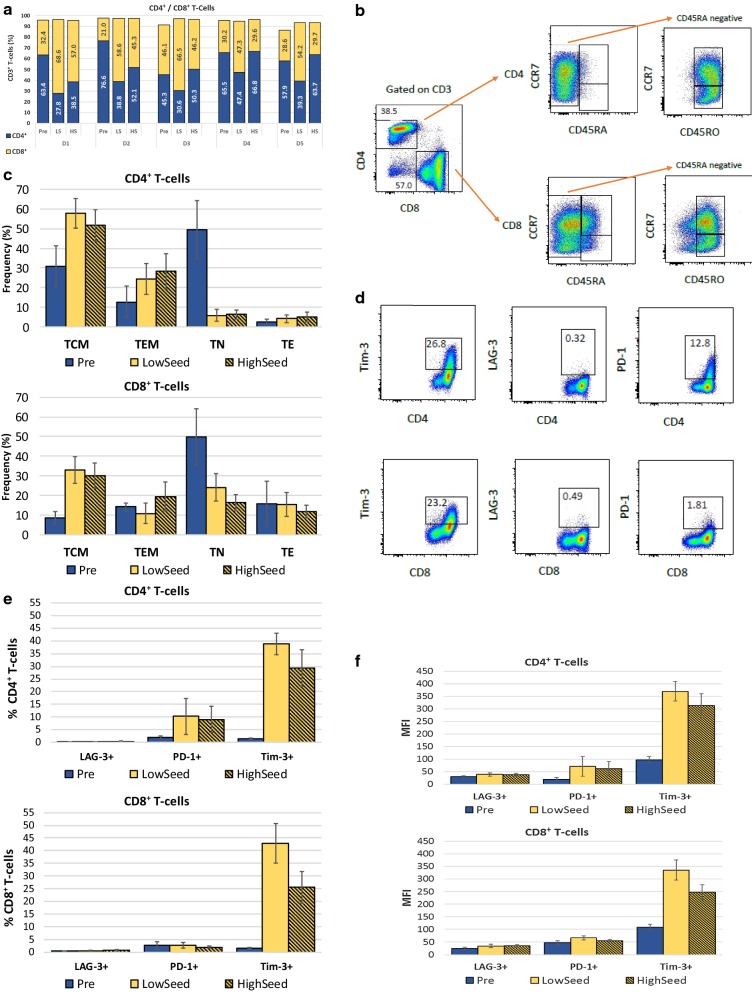
Fig. 4.
Phenotypes of T-cells expanded in the Quantum system. a CD4+/CD8+ T-cell ratios. Percentages of the CD3+ T-cell parent population are shown. Cell populations are shown for pre-seeding (pre) and after harvest (post) for T-cells expanded from PBMCs of 5 healthy donors. b Gating strategy used to identify naive and memory T-cell phenotypes. One representative example is shown (donor 1, high seed). c Frequencies within the CD4+ and CD8+ T-cell populations of TN (CD45RA+/CCR7+), TCM (CD45RO+/CCR7+), TEM (CD45RO+/CCR7−) and TE (CD45RA+/CCR7−) subsets. Data are expressed as % of CD4+ or CD8+ T-cell populations. d Gating strategy used to analyze the expression of exhaustion markers LAG-3, PD-1 and Tim-3 on CD4+ and CD8+ T-cells. One representative example is shown (donor 1). e Frequencies of CD4+ and CD8+ T-cells expressing exhaustion markers. f MFI for expression of exhaustion markers on positively-gated events for CD4+ and CD8+ T-cells. Error bars represent one standard deviation from the mean. Pre pre-expansion PBMCS, LS low seed, HS high seed

