Fig. 5.
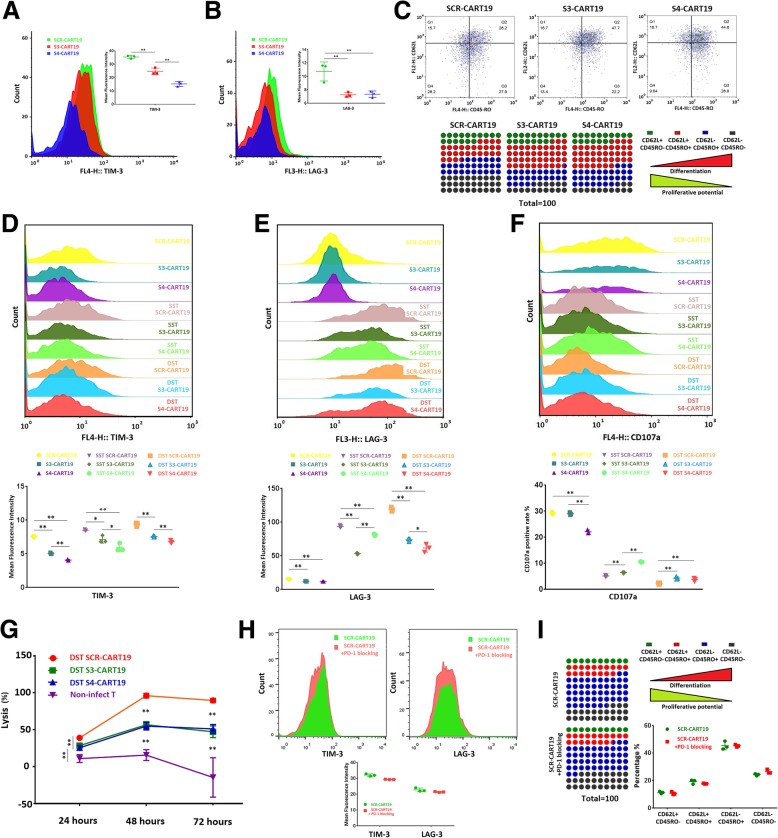
PD-1 knockdown altered T cells’ differentiation kinetics. Tim-3 and LAG-3 in CAR-T cells those were cultured for 13 days were examined by flow cytometry. The expressions of TIM-3 (a) and LAG-3 (b) in PD-1 silenced CAR-T cells were both lower than that in normal CAR-T cells. c The differentiation phenotypes of CD8 positive CAR-T cells cultured for 7 days were tested by flow cytometry. After SST or DST, the expression of TIM-3 (d) and LAG-3 (e) were tested. PD-1 silenced CAR-T cells expressed lower TIM-3 and LAG-3 than SCR-CART19 did. f After SST or DST, the TCIIR induced CD107a expressions were tested. Both SST and DST impaired CAR-T cells CD107a expression, which could be partially rescued by S3 and S4. g The lysis of Raji-luc cells at E:T = 1:5 were continuously monitored for 72 h, and DST SCR-CART19 still presented higher lysis ability than DST S3-CART19 and DST S4-CART19. h CAR-TThe expression of TIM-3 (left) and LAG-3 (right) and the differentiation phenotypes (i) were evaluated in SCR-CART19 cells those were cultured for 10 days. PD-1 blockade by antibodies did not present a similar effect on CAR-T cells as intrinsic PD-1 silencing. 0.01 < *P < 0.05; **P < 0.01. Statistical significance was determined using the ANOVA method for multiple comparisons. Data represent the mean ± SEM of triplicates and are representative of at least 3 independent experiments or are plotted as individual points

