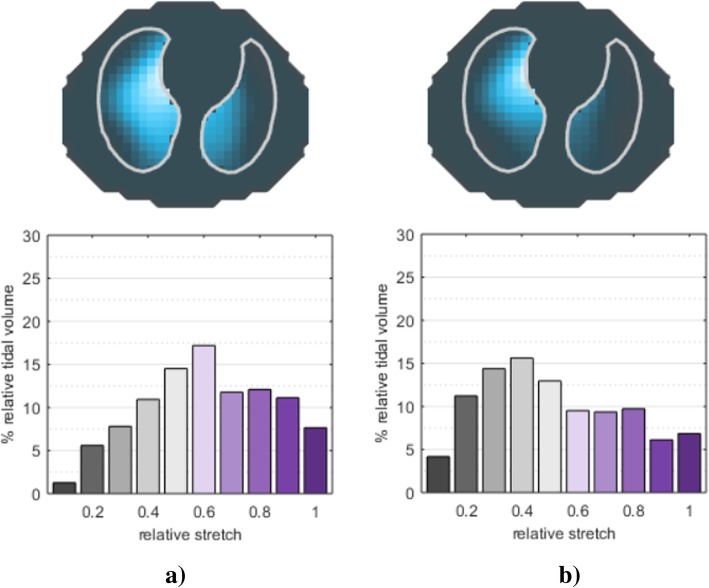
Fig. 2.
Tidal volume distribution during spontaneous breathing (a) and mechanical ventilation (b). Tidal image (top) and relative stretch distribution (bottom) during spontaneous breathing (a) and after intubation and start of controlled mechanical ventilation (b) in the same patient undergoing general anesthesia. During mechanical ventilation, tidal volume is redistributed toward the ventral lung; moreover, hypoventilated areas increase, as shown by the relative stretch histogram (lower values indicate smaller regional tidal volume)

