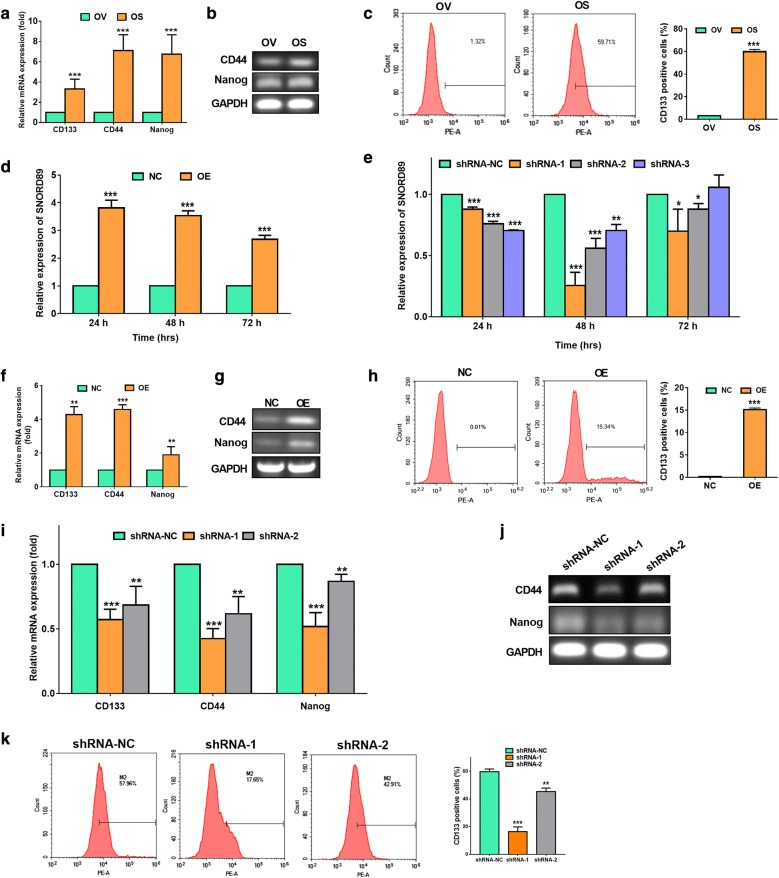
Fig. 3.
Effects of SNORD89 interference on stemness genes expression in ovarian cancer cells. a The mRNA expression of CD133, CD44 and Nanog were detected in OV and OS cells by qRT-PCR. The mRNA expression of these genes in OV cells was set as 1. b The representative agarose gel electrophoresis photos showed the expression of CD24 and Nanog in OV and OS cells after RT-PCR. GAPDH was used an endogenous control. c The comparison of CD133 positive cells in OV and OS cells by flow cytometry analysis. d The SNORD89 expression in OV cells transfected with over expression (OE) of SNORD89 plasmid or negative control (NC) plasmid at 24, 48, and 72 h by qRT-PCR. The SNORD89 expression in OV cells transfected with NC plasmids was set as 1. e The SNORD89 expression in OS cells transfected with silence plasmids of SNORD89 (shRNA-1, shRNA-2, shRNA-3) or shRNA negative control (shRNA-NC) plasmid at 24, 48, and 72 h by qRT-PCR. The SNORD89 expression in OS cells transfected with shRNA-NC plasmids was set as 1. f The mRNA expression of CD133, CD44 and Nanog were detected in OV cells transfected with SNORD89 OE or NC plasmids at 24 h by qRT-PCR. The mRNA expression of these genes in OV cells transfected with NC plasmids was set as 1. g The representative agarose gel electrophoresis photos showed the increased expression of CD44 and Nanog in OV cells transfected with SNORD89 OE. h The increased CD133 positive cells in OV cells transfected with SNORD89 OE by flow cytometry analysis. i The mRNA expression of CD133, CD44 and Nanog were detected in OS cells transfected with shRNA-1, shRNA-2, and shRNA-NC plasmids at 48 h by qRT-PCR. The mRNA expression of these genes in OS cells transfected with shRNA-NC plasmids was set as 1. j The representative agarose gel electrophoresis photos showed the decreased expression of CD44 and Nanog in OS cells transfected with SNORD89 shRNA-1 and shRNA-2. k The decreased CD133 in OS cells after silencing SNORD89 by flow cytometry analysis

