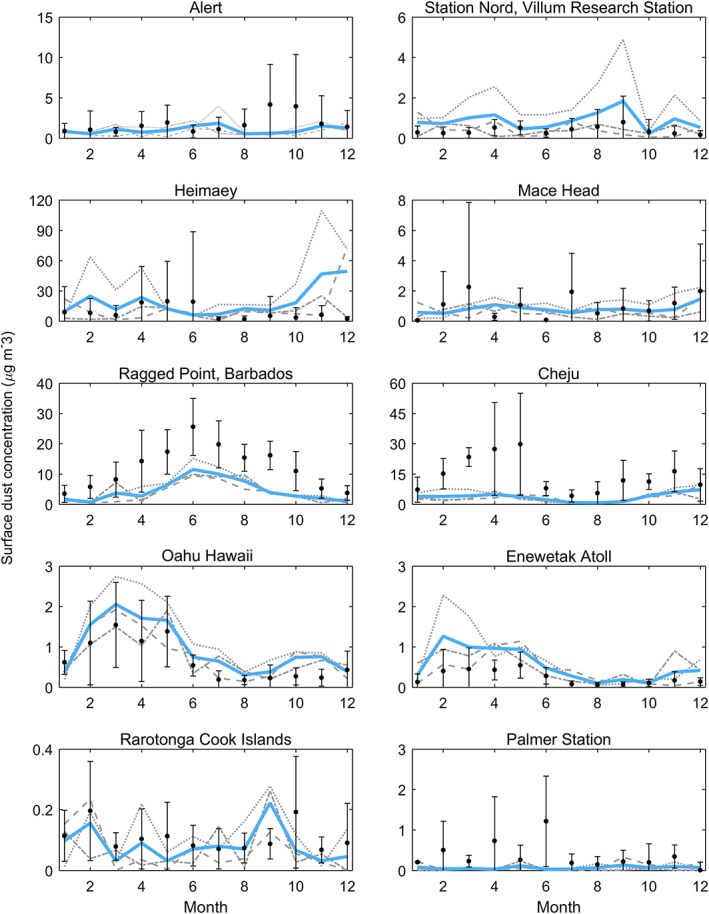
Figure 3.

Monthly mean dust concentration (µg/m3) at ten stations. The figure includes monthly means of observations (black) for the periods indicated in section 2.3 and simulations (grey and blue) for 2010 to 2012. Monthly mean values were estimated based on simulations in 2010 (grey dotted line), 2011 (grey dashed line), and 2012 (grey, dash‐dotted line) and averaged over these three years (blue line).
