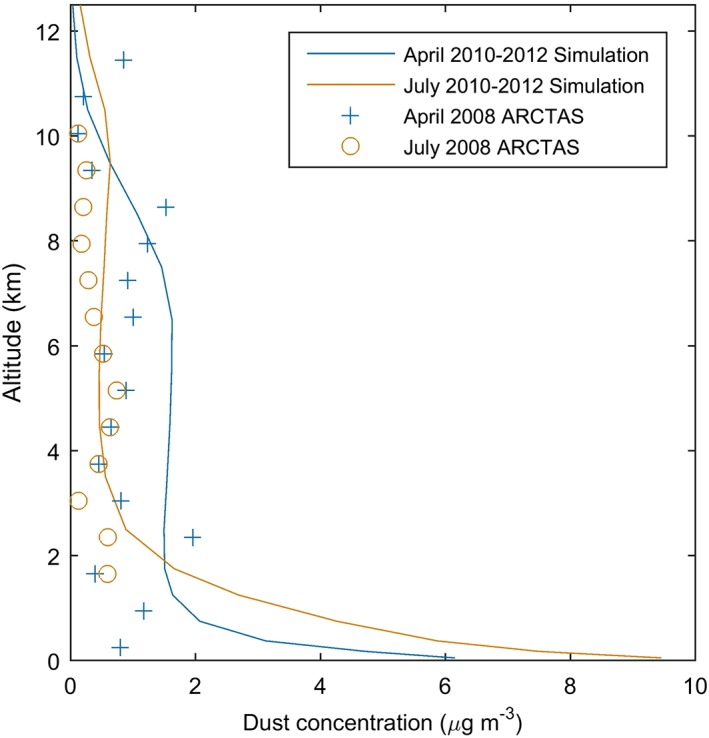
Figure 5.

Monthly mean vertical profiles of dust concentrations in the high Arctic from model simulations (lines) and ARCTAS flight observations (plus and degree signs) in months April and July. Regions of interest for the flight campaigns differed in April and July. To capture the observation area, simulation profiles are averaged for the regions north of 60°N and 170°W to 35°W in April and 135°W to 35°W in July.
