Figure 10.

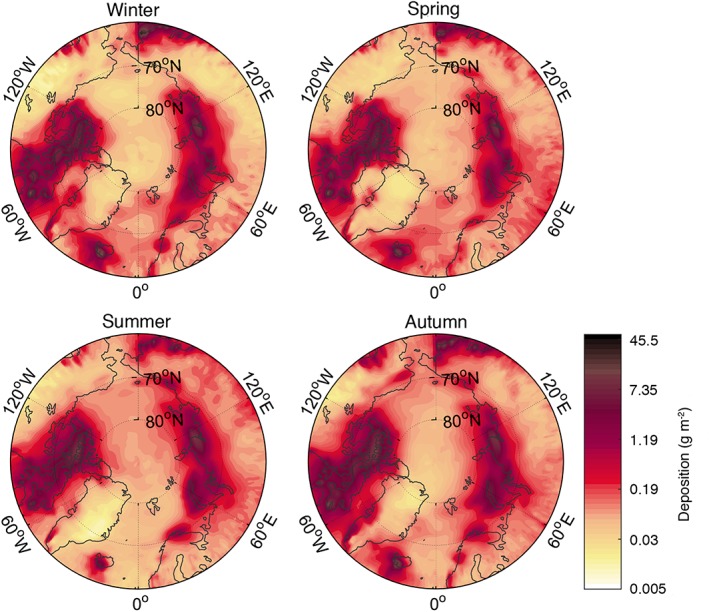
Simulated seasonal dust deposition (g m−2) in the near Arctic averaged for years 2010–2012. Deposition is here given as the sum of dry and wet deposition.

Simulated seasonal dust deposition (g m−2) in the near Arctic averaged for years 2010–2012. Deposition is here given as the sum of dry and wet deposition.