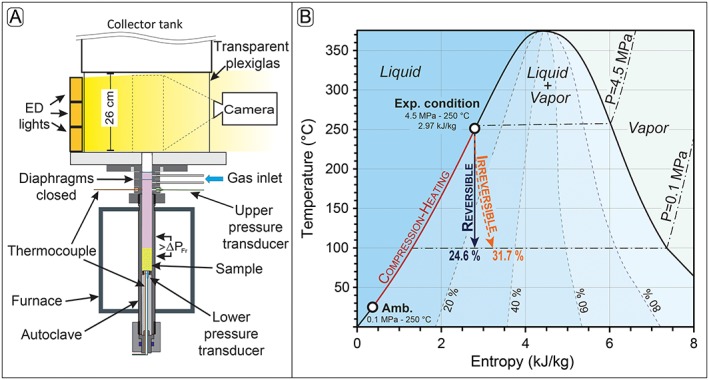
Figure 3.

(a) Schematic drawing of the experimental setup. The bomb allows for the accurate control of temperature, gas overpressure, and decompression rate in order to best represent variable volcanic and hydrothermal conditions. The sample (l = 60 mm, d = 25 mm) is placed in the high‐pressure autoclave. Samples were pressurized up to approximately 3 MPa, then heated at 15°C /min. A final pressure of 4.5 MPa was obtained at the end. The overall pressurization, heating, and dwelling process lasted for about 40 min. A set of diaphragms allow reproducible pressurization of the sample by using argon gas or steam. The dashed box indicates the area observed with the high‐speed camera. Modified after Scheu et al. [2006] and Mayer et al. [2015]. (b) Plot of temperature versus entropy for liquid water and water vapor showing the initial temperature‐entropy state for the experimental condition used in this study (250°C, 2.79 kJ/kg). This diagram includes several types of curves: (1) the isobars (dash‐dotted lines) are calculated at 1 and 4.5 MPa; (2) the dashed lines are contours of equal mass fraction of steam in the coexisting mixture; (3) the dark red continuous line is the thermodynamic path followed during the compression‐heating phase from the ambient (0.1 MPa and ~25°C) to the final experimental condition (4.5 MPa and 250°C), and before the decompression; (4) the continuous dark blue arrow is the thermodynamic path of fluid during decompression under isentropic (reversible) condition and which result in the production of 24.6% of steam; and (5) the dashed orange arrow is the thermodynamic path of fluid during decompression under irreversible condition and which result in the production of 31.7% of steam.
