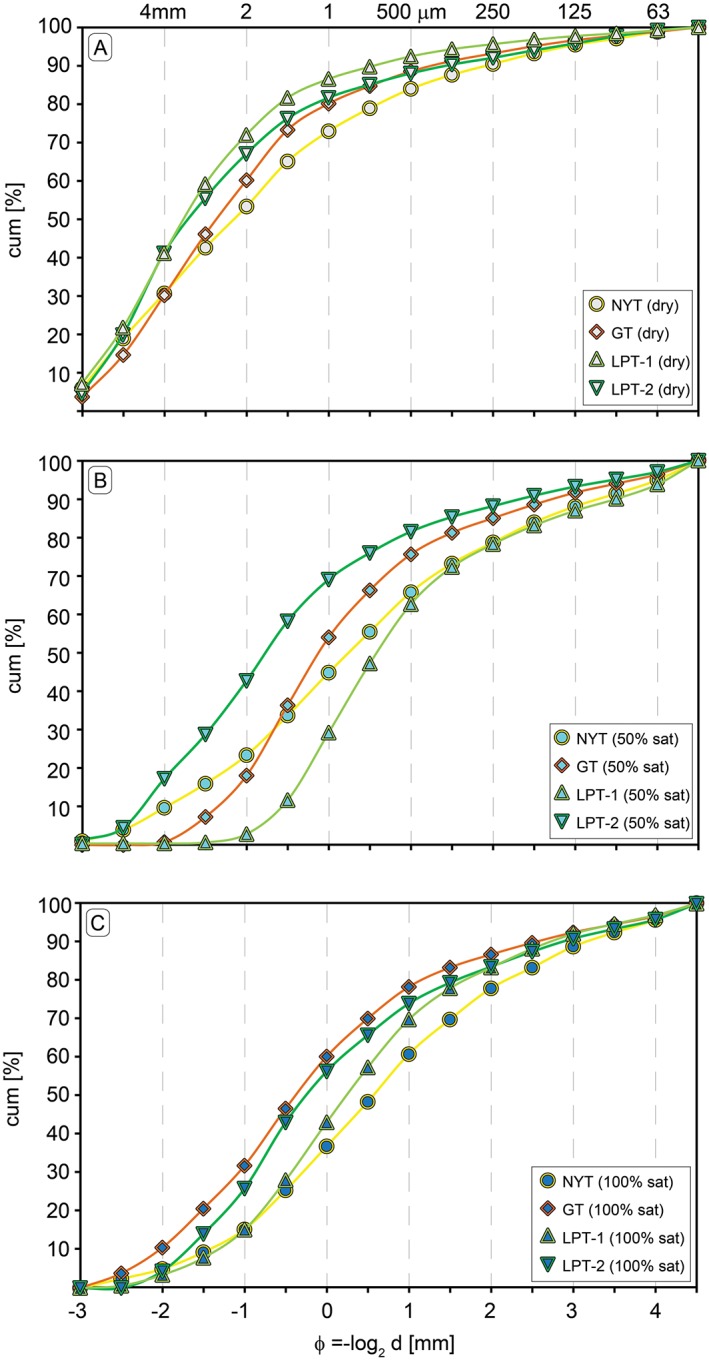
Figure 6.

Cumulative grain size distribution plots for (a) dry, to (b) 50% and (c) 100% saturation conditions. The plots show the weight fractions of particles after rapid decompression experiments at 250°C and 4.5 MPa in half‐ϕ steps (ϕ = −log2 d, with d = particle diameter in millimeter), and in millimeter scale. From dry to fully saturated conditions, the average particle size is decreasing in all plots.
