
Figure 3.
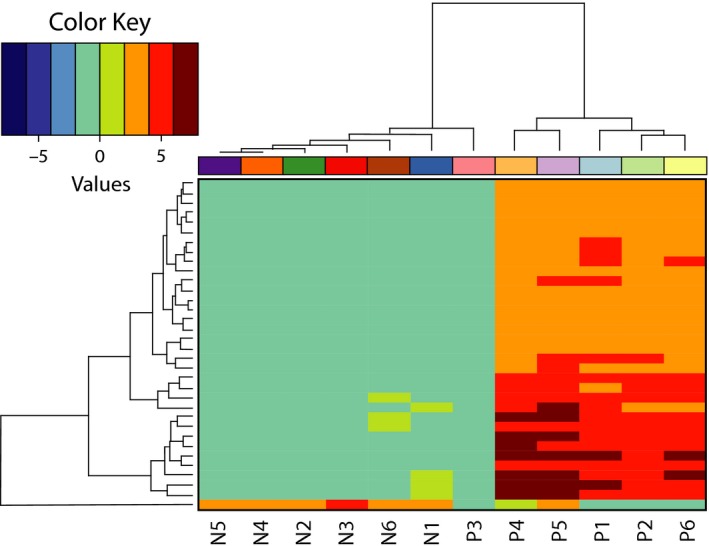
Heatmap of differentially expressed nodes between currently predating and nonpredating third instar Chrysomya rufifacies larvae. This figure shows a heatmap of differentially expressed nodes (rows) in 12 different libraries (columns) of currently predating individual larvae and their nonpredating siblings (same color shade, different intensity), reciprocally hierarchically clustered by similarity in expression pattern