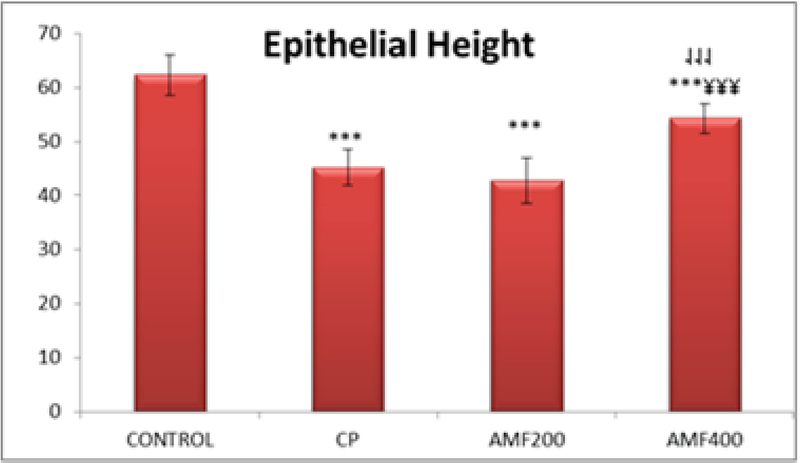
Figure 2.

Testicular tubule epithelial height. Differences are given compared to the control group (*) or CP group ( ). CP: cyclophosphamide group and AMF200 group(
); AMF200 and AMF400: animal groups treated with 200 mg/kg/day and 400 mg/kg/day amifostine, p 0.001.
