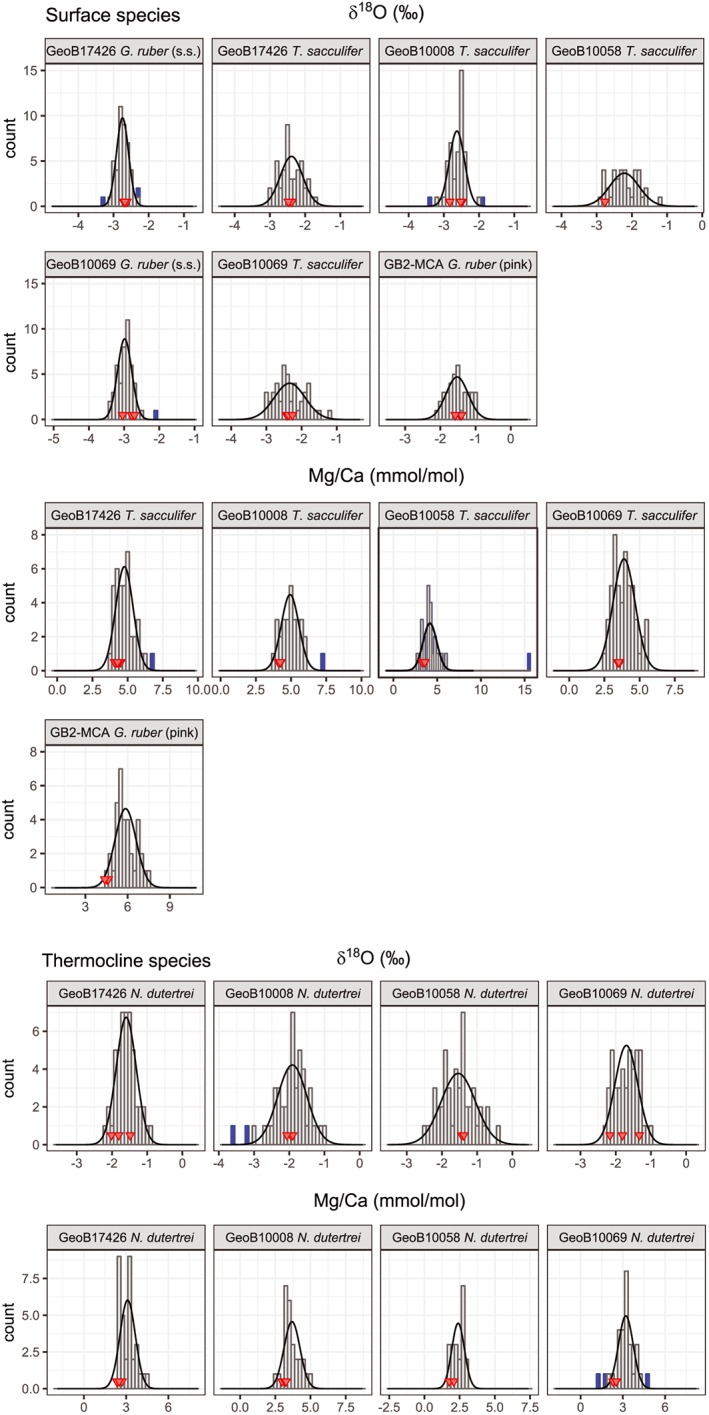
Figure 3.

(a) Single‐specimen δ18O and Mg/Ca distribution of surface dwelling T. sacculifer and dual specimen δ18O and Mg/Ca distribution for G. ruber. (b) Single‐specimen δ18O and Mg/Ca distribution of the thermocline dwelling N. dutertrei. Red triangles indicate samples consisting of pooled specimens. Blue bars indicate IFA characterized as outliers.
