Fig. 4.

HG-responsive interacting proteins of Rac1 in insulin-secreting INS-1832/13 cells
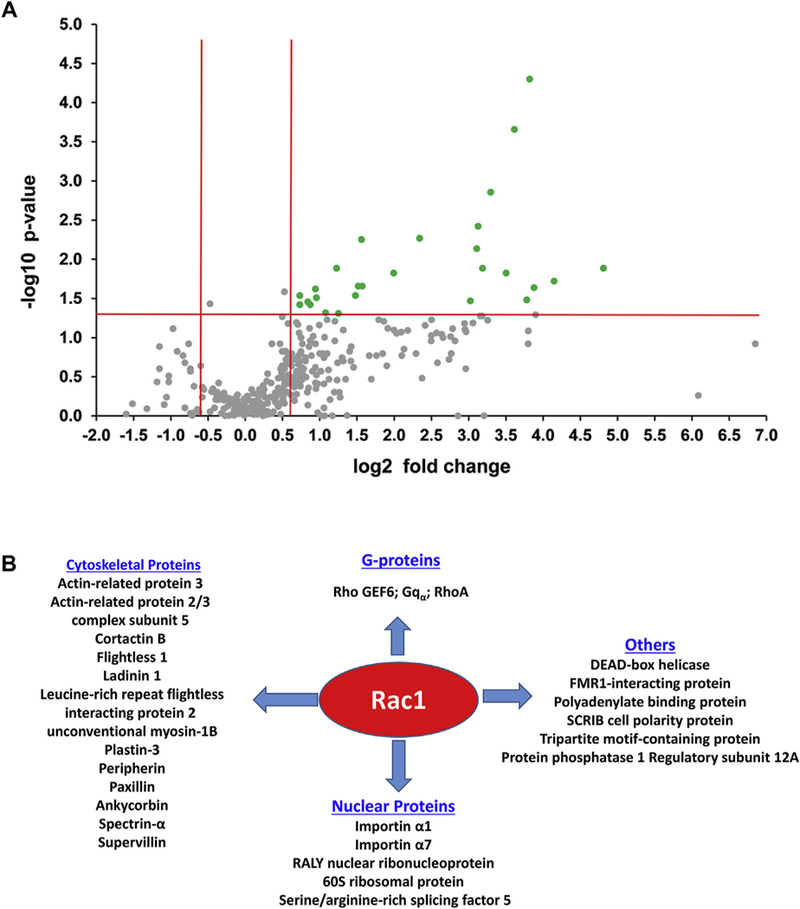
Panel A: Volcano plot for the 324 Rac1 interaction partners with/out high glucose treatments. The green points indicate Rac1 interaction partners with both large magnitude fold-changes (log 2 of fold change, x axis), and high statistical significance (-log10 of p value, y axis). The horizontal red line shows where p = 0.05 with points above the line having p < 0.05 and points below the line having p > 0.05: log (0.05, 10) = 1.30. The vertical red lines show where a fold change for HG vs. LG greater than 1.5 (i.e., 1.5 fold increase) or less than 0.67 (i.e., 1.5 fold decrease): log (1.5, 2) = 0.585. Those points having a fold-change < 1.5 and/or p > 0.05 are shown in gray and those with a fold-change > 1.5 and p < 0.05 are shown in green.
Panel B: Based on the identity and functions of the HG-responsive proteins identified in the current study, we broadly classified those proteins into four major categories, including G-proteins (subunits and regulatory factors), cytoskeletal proteins, nuclear proteins and others (see Table 2 for additional information on these proteins). (For interpretation of the references to colour in this figure legend, the reader is referred to the Web version of this article.)
