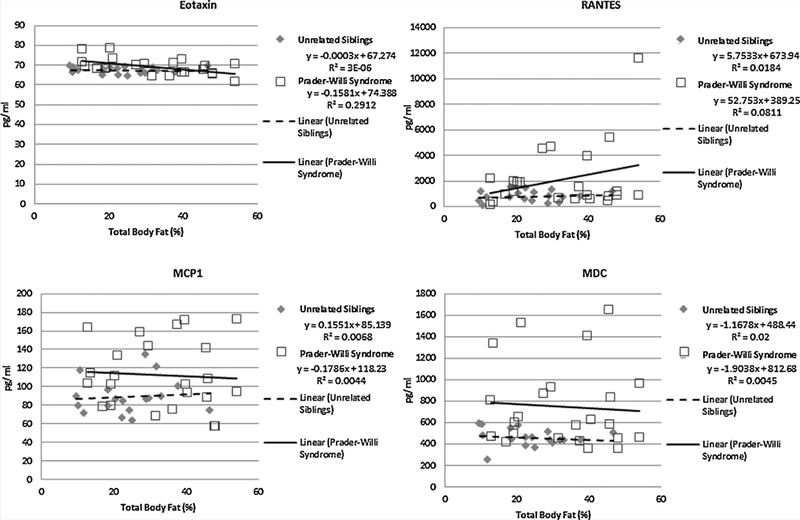
Fig. 3.

Scatter plot representations of data illustrating the relationship between the disturbed chemokine levels (Eotaxin, MCP1, MDC, RANTES) as the dependent variable and percentage total body fat as the explanatory variable for both subject groups (Prader–Willi syndrome vs. unrelated unaffected siblings). Linear equations and their derived best fit regression lines and are presented with R-squared values for both subject groups.
