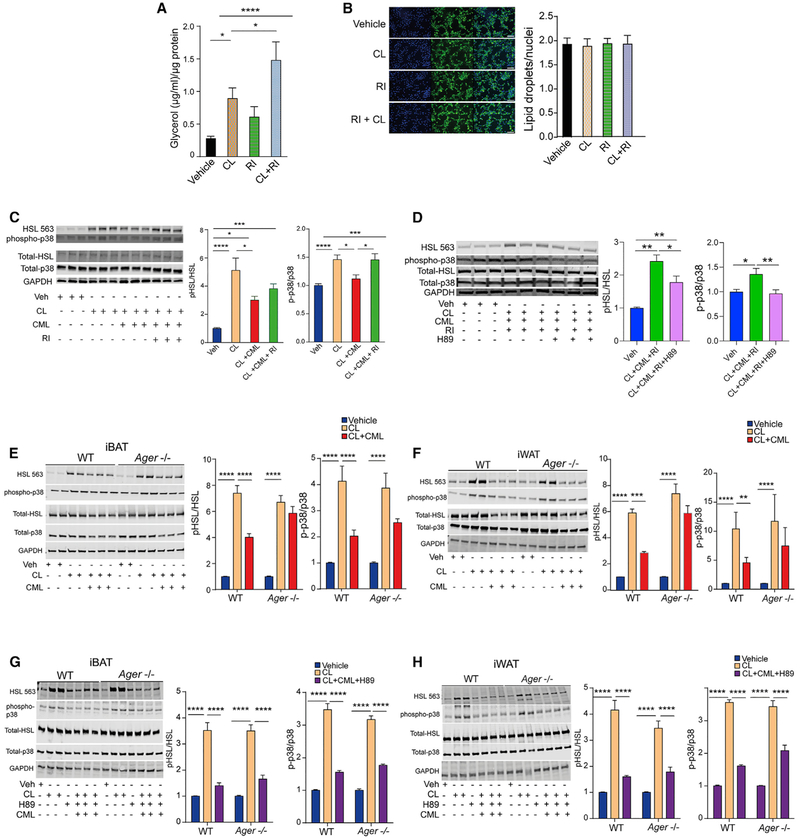
Figure 7. Effects of RAGE Signal Transduction on the PKA Signaling Pathway, Adipocyte Lipolysis, and Phosphorylation of p38 MAP Kinase.
(A) Differentiated adipocytes from C3H10T1/2 cells were serum starved for 3 h and pretreated with the RAGE inhibitor (2- [4- (acetylamino) phenyl] −4- Quinolinecarboxylic acid, methyl ester) (1 μM) for 1 h prior to CL316,243 (10 μM) for 15 min. The mean glycerol content normalized to total protein per well ± SEM is reported from three independent experiments.
(B) C3H10T1/2 cells were differentiated to adipocytes and pre-incubated with a vehicle or the RAGE inhibitor (1 μM) for 90 min prior to CL316,243 (10 μM). Lipid droplets were stained using BODIPY and nuclei stained with DAPI. A representative fluorescence micrograph and mean ± SEM is shown. Scale bar: 100 μm. (C and D) C3H10T1/2 cells were differentiated and treated with a vehicle or CML-AGE (300 μg/ml) for 75 min alone or after pre-treatment with the RAGE inhibitor (1 μM) for 30 min followed by CL316,243 (10 μM) treatment for 15 min.
(C) Cells were lysed and western blotting performed for phosphorylated HSL Serine563, total HSL, phosphorylated p38 MAPK, total p38 MAPK, and GAPDH.
(D) Differentiated adipocytes from C3H10T1/2 cells were treated as in (C) with or without the addition of H89 (20 μM) for 30 min prior to CL316,243 (10 μM). Cells were lysed and western blotting performed for phosphorylated HSL Serine563, total HSL, phosphorylated p38 MAPK, total p38 MAPK, and GAPDH. Band intensities were normalized to the respective total HSL or total p38 MAPK, and the relative fold change is presented as mean ± SEM. Each experiment consisted of at least three independent studies with at least three technical replicates.
(E–H) Primary adipocytes from (E and G) iBAT or (F and H) iWAT of WT and Ager null mice were treated with the RAGE ligand CML-AGE (300 μg/ml) for 1 h, CL316,243 (10 μM) for 15 min, and with or without H89 (20 μM) for 30 min prior to CL. Cells were lysed and western blotting performed for the detection of phosphorylated HSL Serine563, total HSL, phosphorylated p38 MAPK, total p38 MAPK, and GAPDH. Band intensities were normalized to the respective total HSL or p38 MAPK, and the relative fold change is presented as mean ± SEM from N = 4 pooled mice/group in three independent experiments with at least 2–3 technical replicates per experiment.
Data analysis: (A–H) one-way ANOVA followed by a post hoc Tukey’s HSD test or Bonferroni test, as indicated; *p < 0.05; **p < 0.01, ***p < 0.001, and ****p < 0.0001.
See also Figure S7.

