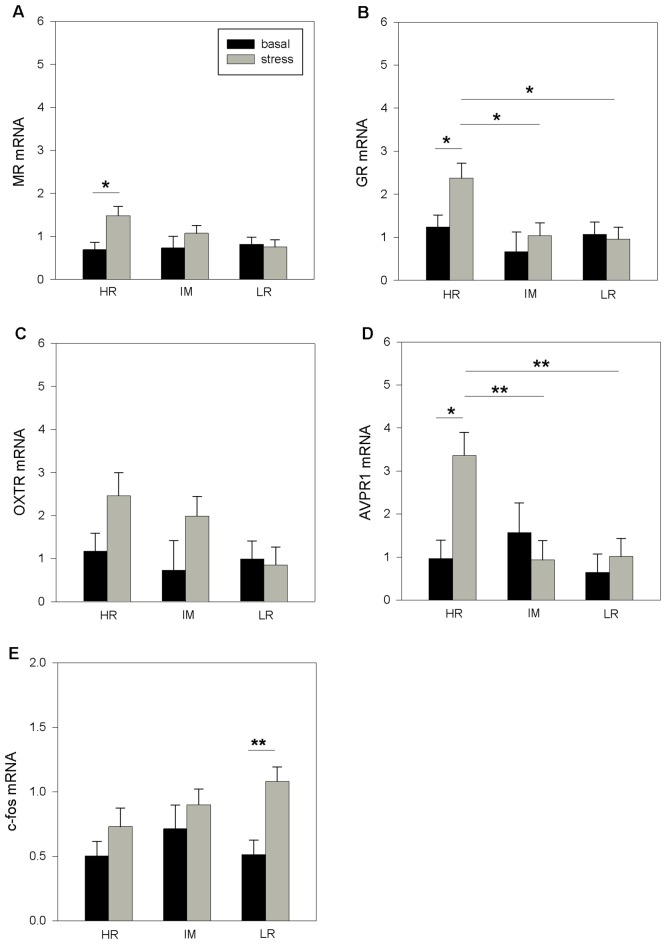
Figure 3.
The basal and stress-induced mRNA expression of MR (A), GR (B), OXTR (C), AVPR1a (D) and c-fos (E) in the hypothalamus of piglets with HR, IM and LR backtest classification. Data are expressed as arbitrary units after normalization to ACTB and TBP mRNA expression as endogenous reference genes and represent the LS means ± SE. Significant differences are indicated by asterisks (*p < 0.05, **p < 0.01; Bonferroni test).

