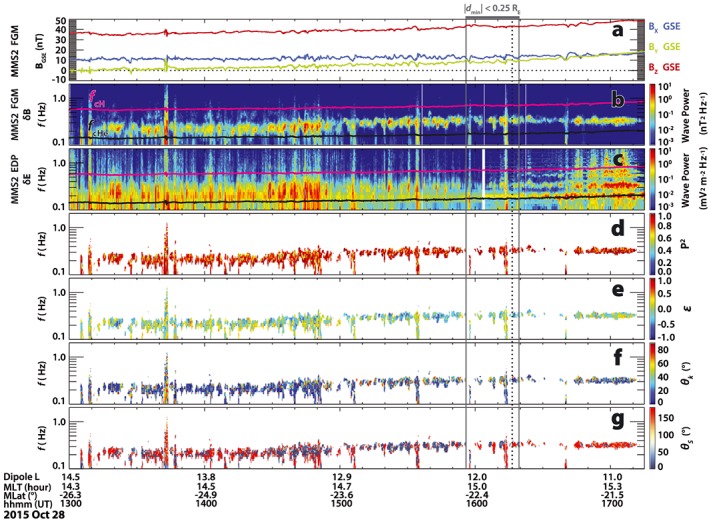
Figure 1.

MMS2 observations of an EMIC wave train and wave properties on 28 October 2015. (a) The magnetic field components in GSE from FGM; (b) δB wave power between 0.1 and 2 Hz from FGM; (c) δE wave power between 0.1 and 2 Hz from EDP; (d) the degree of polarization of the waves, P 2; (e) wave ellipticity, ε; (f) wave normal angle, θ k; and (g) wave Poynting angle, θ S (wave Poynting vector direction relative to the background magnetic field). The degree of polarization, ellipticity, and wave normal angle are determined from the δB wave fields and shown where the δB power is greater than 0.05 nT2/Hz. The gray bar at the top and the gray vertical lines denote where the distance from MMS2 to the local minimum in B (B min) in the southern hemisphere (d min) is less than 0.25 R E. The black dashed vertical line marks d min = 0, indicating the orbit of MMS intersects the local B min location.
