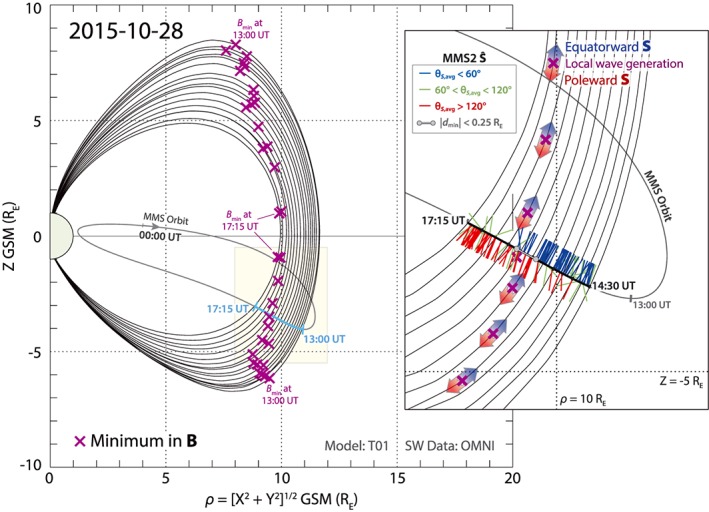
Figure 2.

(left) MMS orbit on 28 October 2015 in the ρ‐Z GSM plane (ρ = [X 2 + Y 2]1/2), with the Sun to the right. The light blue portion of the orbit shows the time interval of the EMIC wave observations in Figure 1. The black traces show the magnetic field line corresponding to the position of MMS from the T01 magnetic field model using OMNI upstream solar wind data, plotted at every 15 min from 13:00 to 17:15 UT. The purple X's overlaid on the field lines show the location of the minimum in B of the modeled magnetic field lines for both the northern and southern hemisphere. The yellow‐shaded region highlights the region of interest (ρ = 8 to 12 R E, Z = −0.5 to −5.5 R E) of the EMIC wave observations from 14:30 to 17:15 UT. (right, inset) A closer view of the modeled magnetic field lines and B min locations in the yellow‐shaded region, as well as the Poynting unit vector per wave packet projected into the ρ‐Z GSM plane from 14:30 to 17:15 UT. Each Poynting unit vector is colored by the average θ S shown in Figure 1g for that wave packet, where blue denotes θ S,avg < 60° (parallel to the magnetic field), green 60° < θ S,avg < 120° (perpendicular), and red θ S,avg > 120°(antiparallel). The light gray circles and line segment show where d min is less than ±0.25 R E, coinciding with the bidirectional Poynting vector observations around 15:55–16:20 UT. The large blue‐to‐red arrows centered on the B min locations show schematically how the observed wave Poynting vector direction depends on the position of the spacecraft relative to a wave generation region, especially for an off‐equator generation region.
