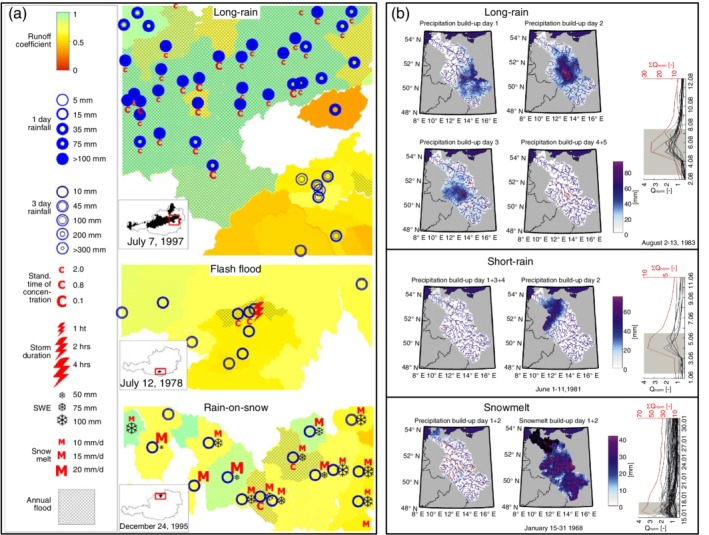
Figure 3.

An example of diagnostic maps for classification of river flood events based on expert judgment according to (a) Merz and Blöschl (2003): Diagnostic maps of event‐ and catchment‐averaged indicators (event runoff coefficient, 1‐day and 3‐day rainfall depth, standardized time of concentration, storm duration for documented convective thunderstorms, snow water equivalent [SWE], snowmelt amount) on the day of occurrence of various annual flood events in Austria. (Reprinted with permission from Merz and Blöschl (2003). Copyright 2003 Wiley); (b) Nied et al. (2014): Daily diagnostic maps of build‐up period for exemplarily flood events in the Elbe catchment. The intensity of blue color indicates daily precipitation or snowmelt amount [mm]. Affected gauges are indicated by the red dots. The hydrographs (black lines) in the left panel correspond to observed discharge at the affected gauges normalized by their 2‐year flood. Red line corresponds to the discharge sum. Gray rectangular indicates the build‐up period of flood event. (Reprinted with permission from Nied et al. (2014). Copyright 2014 CC BY)
