
Figure 4.
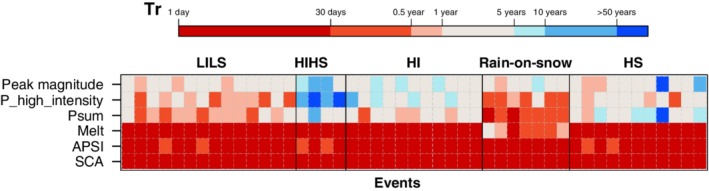
Empirical return periods (Tr) of parameter event values for different flood‐precursor storylines (i.e., hydrometeorological and catchment state conditions leading to flood event): LILS low intensity—low sums; HIHS high intensity—high sums; HI high intensity; rain‐on‐snow; HS high sums. Each row corresponds to return period of respective parameter: APSI—antecedent precipitation and snowmelt index; SCA—snow‐covered area; Psum—volume of rainfall; P_high_intensity—95th quantile of spatial precipitation distribution on the day with maximum rainfall amount; melt—accumulated snowmelt over the course of the event; peak magnitude—Peak discharge of respective flood event. Each column corresponds to an individual flood event. (Reprinted with permission from Keller et al. (2018). Copyright 2017 Wiley)