. 2019 Jun 21;10(29):6944–6956. doi: 10.1039/c9sc02197c

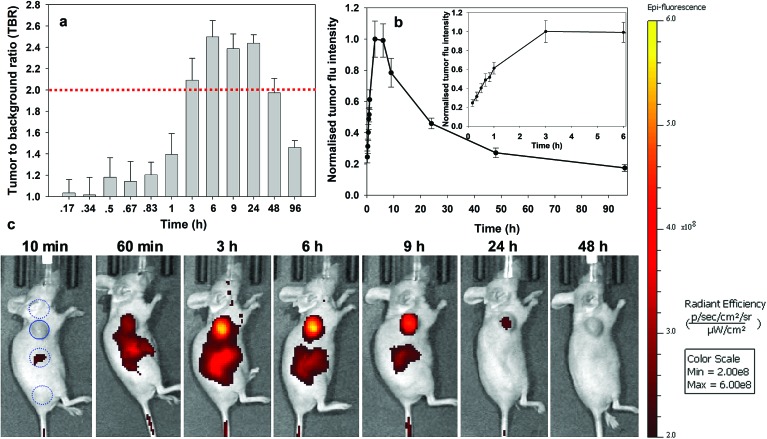
Fig. 8. Analysis of in vivo fluorescence imaging for bio-responsive RGD NIR-AZA 2 (13.2 nmol) over time (n = 4). (a) Plot of TBR values at individual time-points over 96 h, dashed red line indicating threshold value of 2. Values determined by ROI total fluorescence signal of tumour divided by an averaged value of three independent background regions as measured by living image software v4.7. (b) Plot of tumour fluorescence intensity over 96 h, inset shows expansion of 0–3 h. (c) Representative in vivo fluorescence images of 2 using a MDA-MB 231 subcutaneous tumour model at different time points (scale bar identical to Fig. 9 and 10). First image shows selected tumour ROI (solid circle) and three background ROIs (dashed circles).

Fig. 8