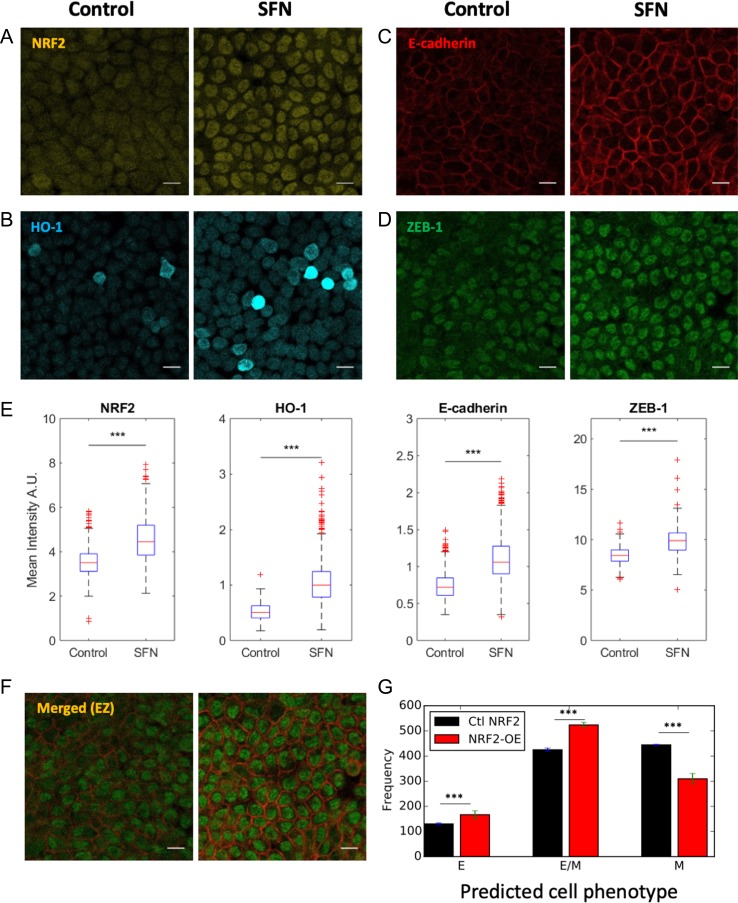
Figure 4.
NRF2 upregulation enhances the hybrid E/M phenotype in vitro. (A-D) Control and SFN treatment for NRF2, HO-1, E-cadherin and ZEB-1. Scale bar: 20 μm. (E) Box plot of Control vs SFN for NRF2, HO-1, E-cadherin and ZEB-1. Data are shown as a boxplot of cell intensity in arbitrary units (A.U.). The data was analyzed in MATLAB and the Student’s two-tailed t-test was used; ‘***’ denotes a p-value < 0.001. At least 1000 cells per condition were measured in each experiment. Images are representative of at least 3 independent experiments. (F) Merged view of E-cadherin and ZEB-1. Scale bar: 20 μm. (G) Fraction of E, E/M, and M cells exposed to varied level of chosen randomly in [] molecules for a control case with NRF2 (black) and 4-fold NRF2 overexpression (red). Cell classification was done upon full equilibration. Error bars indicate the standard deviation of three independent simulation sets (n = 1000 independent cells for each set). p-values were computed using a two-tailed paired t-test.

