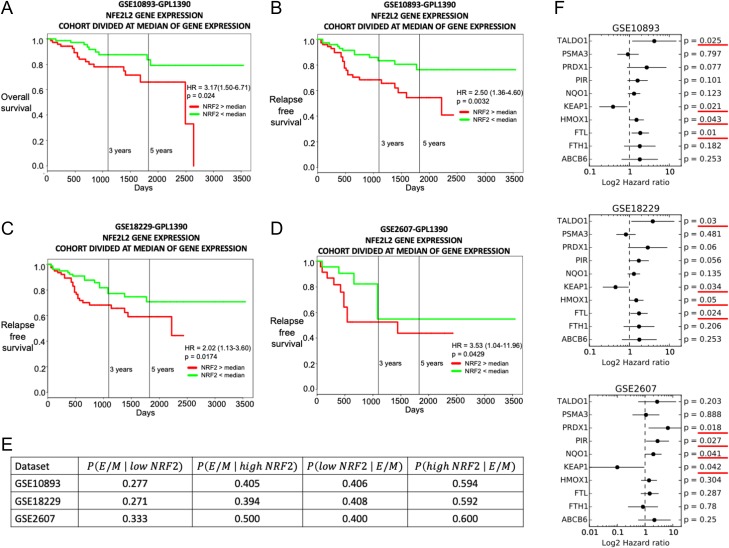
Figure 6.
NRF2 correlates with a worse clinical outcome in cancer patients. (A) Overall survival for GSE10893. The group of patients with low NRF2 (green curve) had better survival than the group with high NRF2 (red curve). (B) Relapse-free survival for GSE10893. (C) Relapse-free survival for GSE18229. (D) Relapse-free survival for GSE2607. (E) Left: conditional probability of exhibiting a hybrid E/M EMT score given a low NRF2 expression (second column) or a high NRF2 expression (third column). Right: conditional probability of a low NRF2 level (forth column) or a high NRF2 level (fifth column) given a hybrid E/M EMT score. (F) Hazard ratio, 95% confidence interval (error bars) and p value for several NRF2 downstream target genes for GSE10893 (top), GSE18229 (centre) and GSE2607 (bottom).

