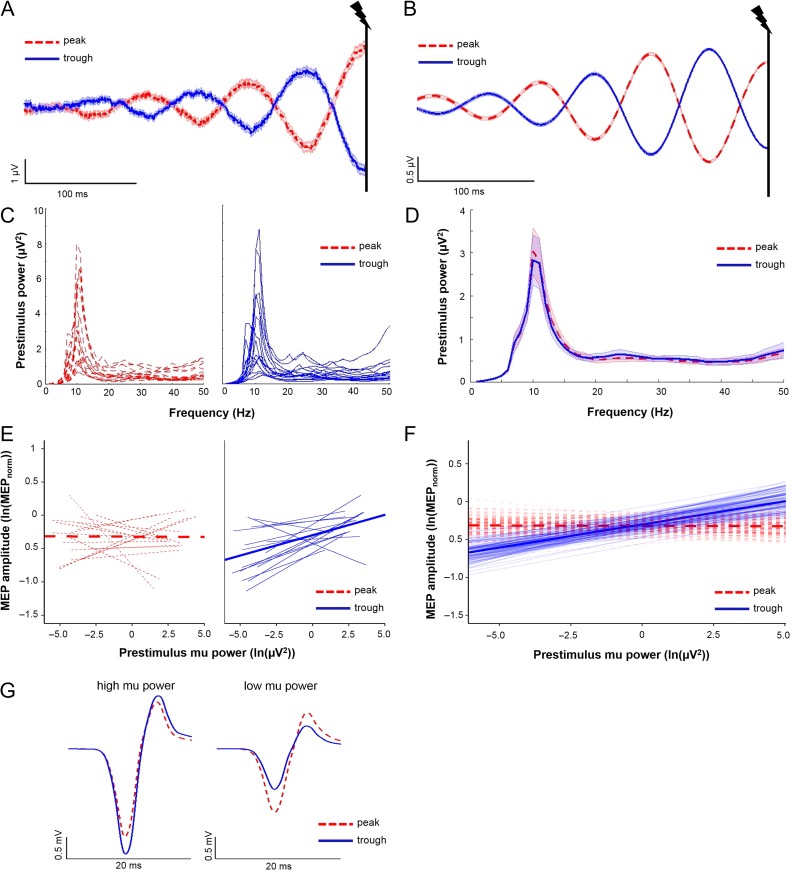
Figure 3.
Interactions between mu oscillatory phase and power influence MEP amplitudes. (A and B) Averaged raw (A) and band-pass filtered (B) C4-Hjorth data for mu peak trials (dashed red lines) and mu trough trials (solid blue lines; 0.3 s of the 6 s shown). The vertical black lines indicate time of TMS delivery at 3 s. Shading, ± 1 SEM. Note the accurate categorization of mu peak and troughs in TMS stimulated trials. (C) Individual subject power spectral density estimates for mu peak trials (dashed red lines) and mu trough trials (solid blue lines). (D) Group averaged power spectral density estimates for mu peak trials (dashed red) and mu trough trials (solid blue). Shading, ± 1 SE. For (C and D), note that power spectral density estimates are close to zero between 1 and 6 Hz due to low frequency resolution below 6 Hz (window size for estimating PSD: 150 ms). (E) Individual subject regression lines (thin) and group-level model-fits (thick) depicting relationships between prestimulus mu power and MEP amplitude for mu peak trials (dashed red lines) and mu trough trials (solid blue lines). A greater proportion of subjects showed a positive relationship between mu power and MEP amplitudes when TMS occurred at mu troughs relative to mu peaks. (F) Group-level model fits (thick solid lines) depicting relationships between prestimulus mu power and MEP amplitudes for mu peak (dashed red lines) and mu trough (solid blue lines) trials, with 100 randomly chosen estimates of group-level model fits (generated using a bootstrapping procedure; thin transparent lines). Note that the group-level model fits intersect at mid-range power levels. (G) Averaged MEP traces from a representative subject obtained at mu troughs (solid blue line) and mu peaks (dashed red line) when mu power was highest (i.e., within the top 10% of all trials used for mu statistical modeling), and when mu power was lowest (i.e., within the bottom 10% of all trials used for mu statistical modeling). Note that the direction of mu phase-dependency of MEP amplitude reverses between high and low mu power levels. N = 17 for panels (A–F); 2 subjects excluded due to noisy EEG signals during TMS trials; 1 subject excluded due to technical problems with neuronavigation-derived coil position data.

