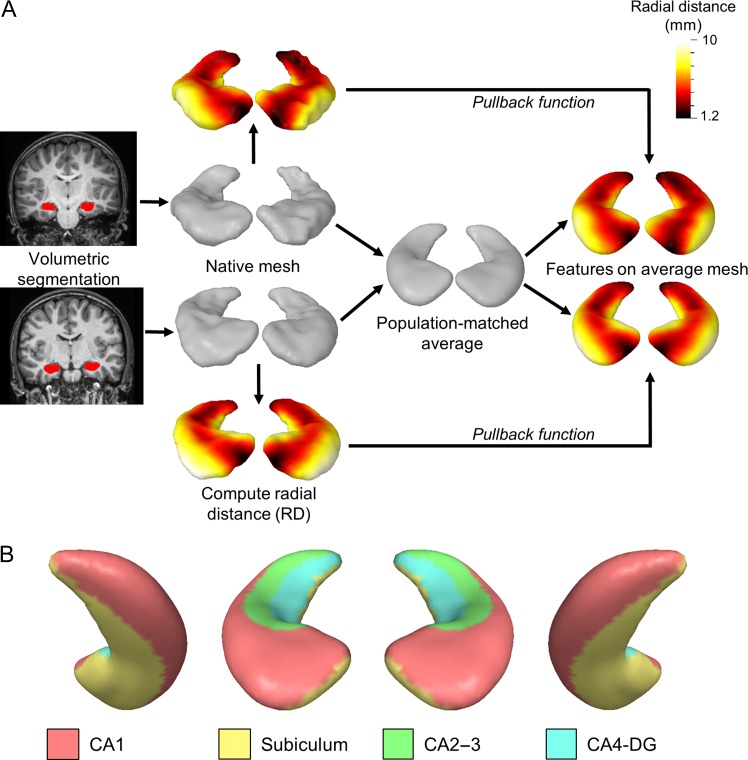
Figure 2.
Shape analysis method and hippocampal surface anatomy. (A) Example hippocampal shape analysis procedure from two sample subjects. Hippocampal volumes are segmented from the T1-weighted image using FSL. Each volume surface is converted to a triangulated mesh in native space using MOCA and the RD is computed per vertex. Individual meshes are then averaged together to generate a population-matched average atlas. A pullback function is then applied to project individual RD metrics to the atlas surface to allow for one-to-one correspondence of features. (B) The putative location of subfields are shown on the average hippocampal surface using approximate geometric landmarks from (Winterburn et al. 2013; Iglesias et al. 2015; Yushkevich, Amaral, et al. 2015). From left to right, the right inferior posterior, right superior anterior, left superior anterior, and left inferior posterior surfaces are shown.

