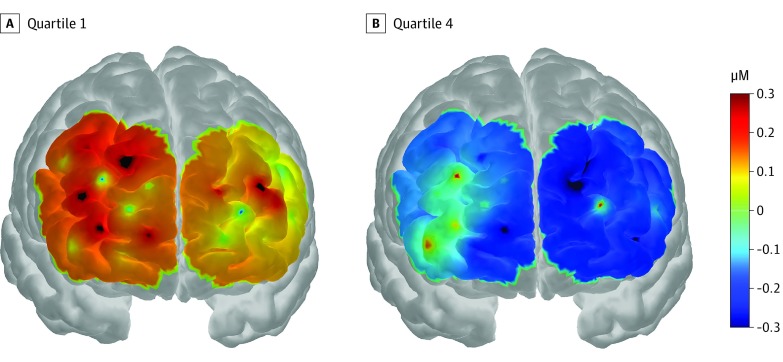
Figure 3. Activation and Deactivation Responses in Quartile 1 (Q1) and Quartile 4 (Q4) Residents.
Group-averaged oxygenated hemoglobin concentration (HbO2) concentration change in the prefrontal cortex among Q1 and Q4 residents during the time pressure condition. The displayed concentration change was averaged from 10 to 50 seconds after stimulus onset. The color bar indicates the scale of the concentration change in micromoles. The anatomical coregistration for probes was anchored using standard electroencephalogram 10-5 landmarks onto the Colin 27 head model.

