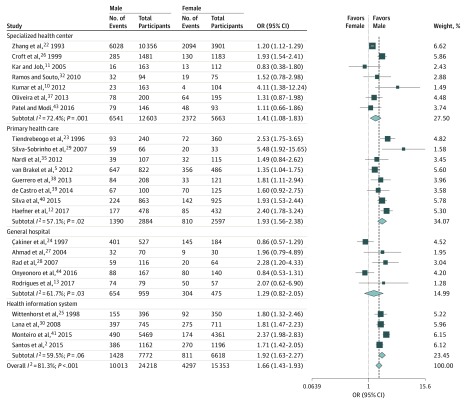
Figure 1. Subgroup Analysis for Sex by Location of Enrollment.
Square data markers represent odds ratio, with size representing the statistical weight of the study using random-effects analysis. Error bars represent 95% CI. Diamond data marker represents the overall OR and 95% CI for the outcome of interest.

