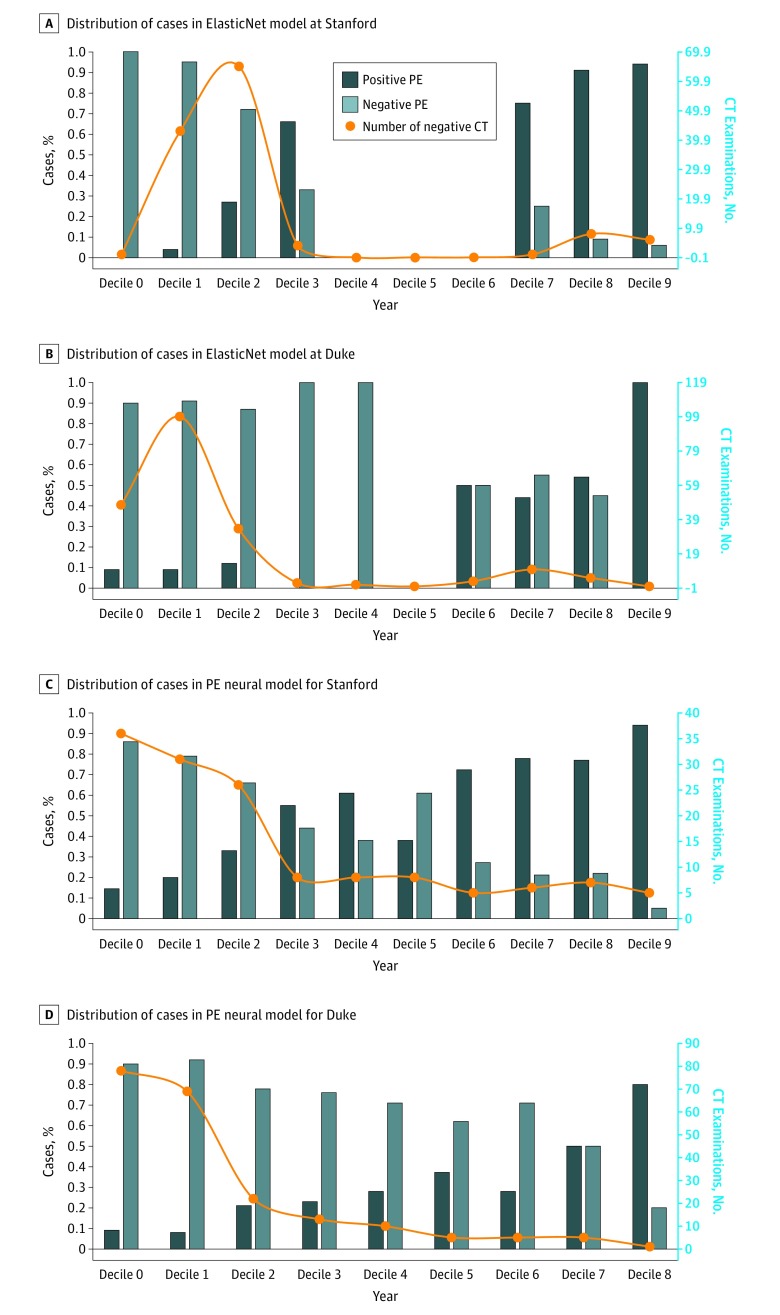
Figure 3. Performance in Setting 1 and 2.
Distribution of positive and negative cases in decile of predicted probability value on the primary y-axis and true number of negative computed tomographic (CT) examinations in each decile fitted as a curve on the secondary y-axis: proposed ElasticNet model for the holdout test set from Stanford (A) and Duke (B) and pulmonary embolism (PE) Neural model for the holdout test set from Stanford (C) and Duke (D).

