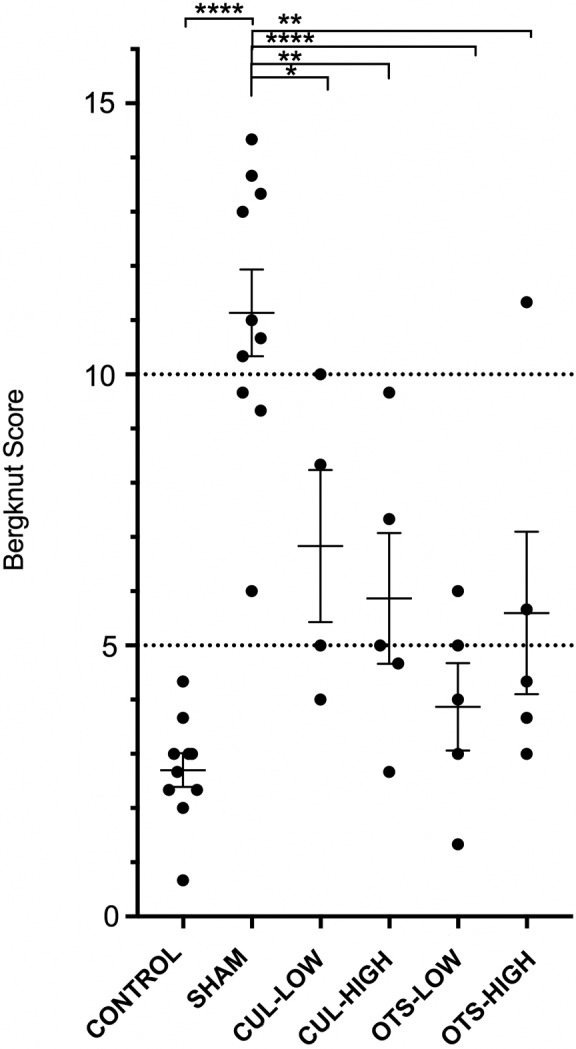
Figure 4.

Histological classification. Scatter plot representing an overview of the average histological canine‐specific Bergknut score with standard error of the mean. Low and high indicates dosage of 1 × 10⁵ and 1 × 10⁶ cells per disc, respectively. Significance is determined by 1‐way analysis of variance (anova) followed by Tukey’s test and is signified as *P ≤ .05, **P ≤ .01, ***P ≤ .005, ****P ≤ .001
