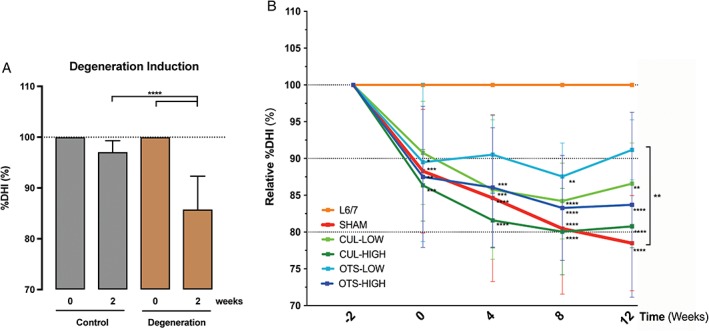
Figure 6.

Disc height index (DHI) assessment. A, Average DHI determined for all discs prior and 2 weeks after degeneration induction. “Control” group represents nondegeneration L6/7 discs and “degeneration” are the collected L3/4, L4/5, and L5/6 DHI values. B, Average DHI tracked over 12 weeks. All values are set as a fraction of the DHI measurements prior to manipulation and subsequently placed relative to the internal control. Weeks represent the time after cell transplantation. Significance is determined by 2‐way analysis of variance (anova) and Tukey’s test. Significance is signified compared to the healthy control unless stated otherwise. *P ≤ .05, **P ≤ .01, ***P ≤ .005, ****P ≤ .001. Graph demonstrates mean values (±SD)
