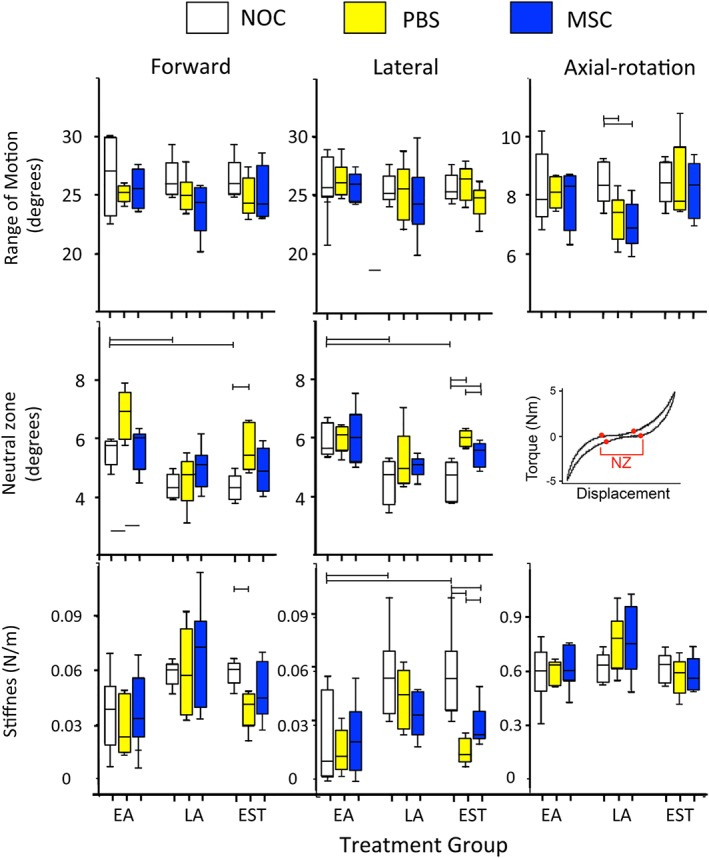
Figure 6.

Biomechanical testing of IVDs from the early Acute early (EA), late Acute (LA) and established (EST) treatment groups. Horozontal bars represent statistical comparisons between data sets that were made. Six tissue samples were tested in each case and mean values ± SDs plotted. Lesion induction was performed for 4 weeks in the EA and LA groups and 12 weeks in the EST group and which had undergone an 8 or 22 week recovery period (EA and LA groups) or 14 weeks (EST group)
