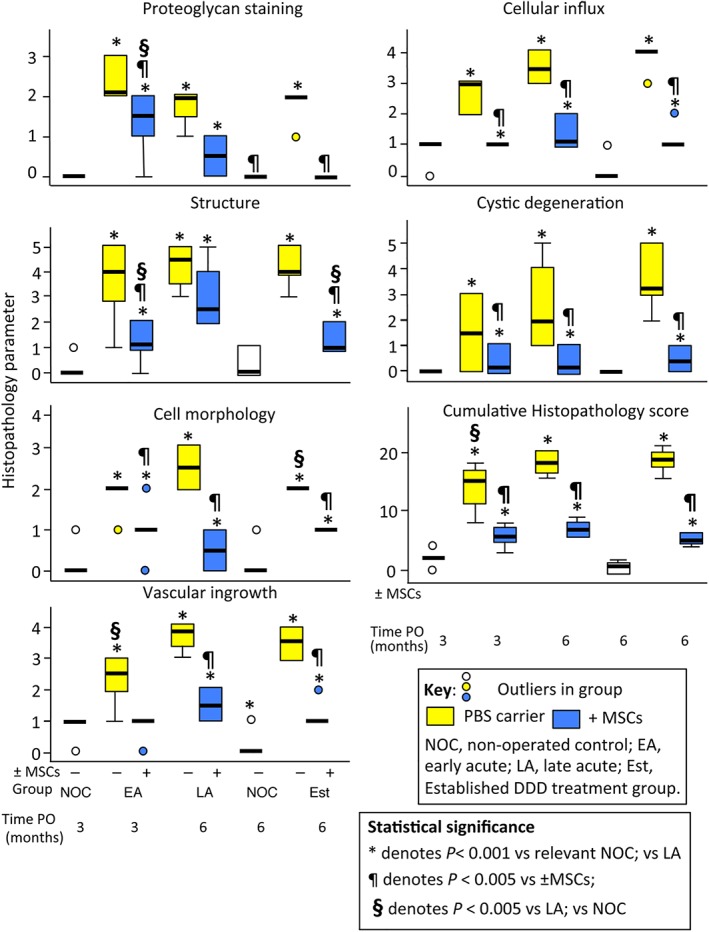
Figure 7.

Histopathological scoring of IVDs from the nonoperated control (NOC), early Acute (EA), late Acute (LA) and established (EST) treatment groups. The box plots depicted represent 25/75% percentiles, median values are indicated by horizontal lines, ranges are represented by the whiskers. For explanations and histological examples of the descriminative criteria scored see Table SS1, and Figures SS2–SS8. Lesion induction was performed for 4 weeks in the EA and LA groups and 12 weeks in the EST group. The tissues which were scored had undergone an 8 or 22 week recovery period (EA and LA groups) or 14 weeks (EST group)
