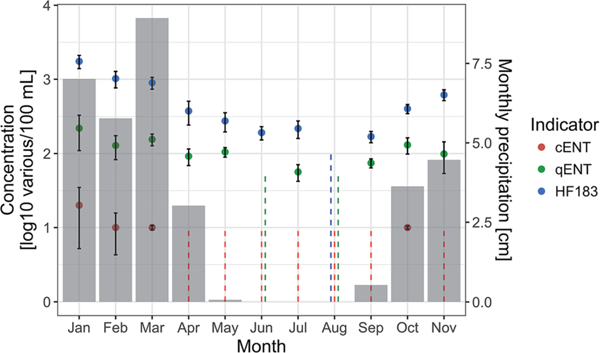
Fig. 2.

Median indicator values by month, aggregated over years 2014 and 2016. Grey bars represent mean monthly precipitation over years 2014 and 2016. Error bars represent bootstrapped standard errors, based on 1000 bootstrap samples. Dashed lines represent the interval containing the median for the months in which medians were below the highest LDC for each indicator, i.e., <10 MPN/100 mL, <53 CCE/ 100 mL, and <105 copies/100 mL for cENT, qENT, and HF183, respectively. Note that due to this log 10 representation, the dashed line intervals only extend to 0 log 10 (equal to 1 in original concentration units), while the true intervals extend to include 0 in original concentration units.
