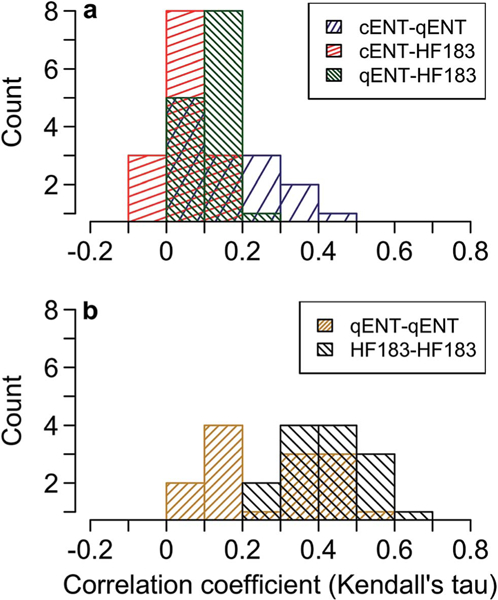
Fig. 3.

Histograms of correlations between indicators at each station (14 stations with n = 75 at each station, except for stations at which qENT failed SPC measures, see Table 2). (a) Depicts correlations between different indicators, and (b) depicts correlations between analytical duplicates of each molecular assay: the qENT assay (”qENT-qENT”) and the HF183 assay (“HF183-HF183”), respectively. Correlation coefficient is Kendall’s tau-a for left-censored data.
