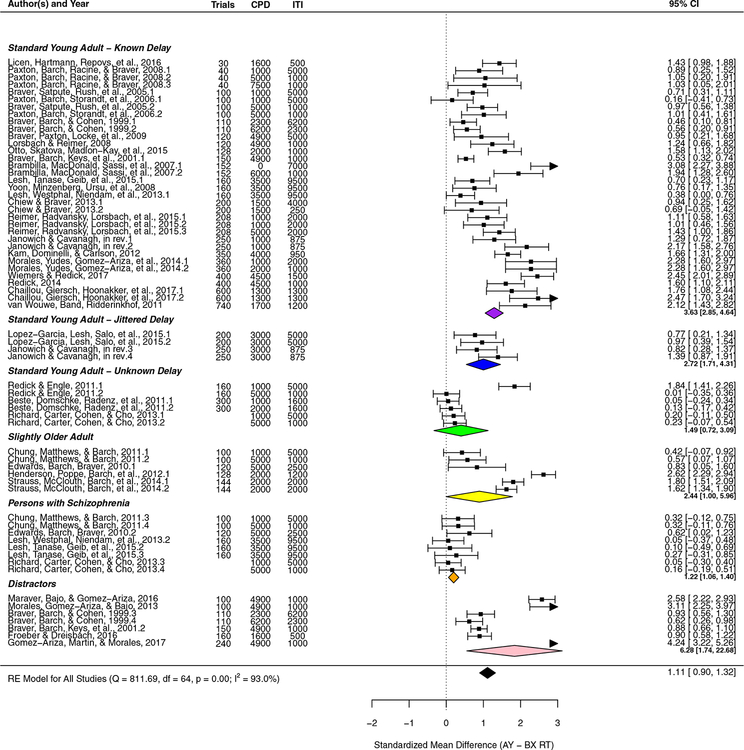
Fig. 4.
Forest plot of proactive/reactive control reaction time difference. Forest plot ordered by subgroup, delay knowledge, and trial set count. Cue–probe delay (CPD) (ms) and intertrial interval (ITI) (ms) are also included for reference. Scores reflect the standardized mean difference of AY-BX reaction time and 95% confidence interval (CI), with more negative scores indicating greater reactive control and more positive scores indicating greater proactive control. Triangles on the CI bars indicate CIs that exceed the plotting range of standardized mean differences. Colored diamonds show the random effects model summary scores for each subgroup, and the black diamond at the base shows the overall random effects model summary for all studies combined. (Color figure online)

