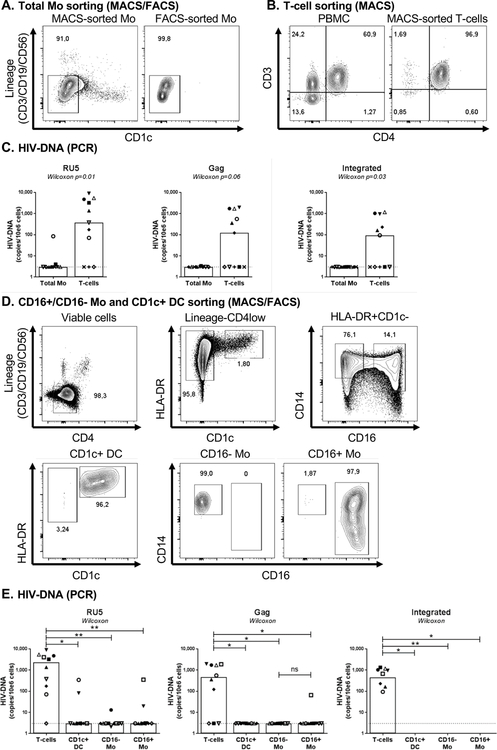
Figure 1. HIV-DNA quantification in blood myeloid cells sorted by MACS and FACS from HIV+ART individuals.
(A) Monocytes (Mo) were purified from the peripheral blood monucleated cells (PBMC) of HIV-infected on ART individuals (HIV+ART; Table 1a) by negative selection using magnetic associated cell sorting (MACS). To insure high purity of the Mo population with no T cells contamination, total Mo identified as cells with a CD3-CD19-CD56-CD1c- phenotype were subsequently sorted by FACS upon staining with CD3, CD56, CD19, and CD1c Abs. Post-sort purity was >96%. (B) Total CD4+ T-cells were isolated by MACS from matched donors. (C) Levels of early (RU primers; left panel), late (Gag primers, middle panel) HIV reverse transcripts and integrated HIV-DNA (Alu/HIV primers; right panel) were quantified by nested real-time PCR. (D) Highly pure CD14+CD16- and CD14+/lowCD16+ Mo (CD3-CD19-CD56-HLA-DR+CD1c-) and CD1c+ DC (CD3-CD19-CD56- HLA-DR+CD1c+) were sorted by FACS upon staining of the total Mo fraction with CD3, CD4, CD56, CD19, CD14, CD16, HLA-DR and CD1c Abs (upper panels). Post-sort purity of Mo and DC was >96% (lower panels). (E) Levels of early (left panel), late (middle panel) HIV reverse transcripts and integrated HIV-DNA (right panel) were quantified by nested real-time PCR. The lines indicate the limit of detection: 3 HIV-DNA or CD3 copies per PCR replicate. Each PCR reaction was performed in 3–10 replicate wells and median values were calculated. Each symbol represents one different HIV+ART individual (n=10). The limit of detection (3 HIV-DNA copies/test), indicated by the dotted lines, was assigned to any undetectable sample. Wilcoxon paired non-parametric test p-values are indicated on the graphs in panels C and E.

