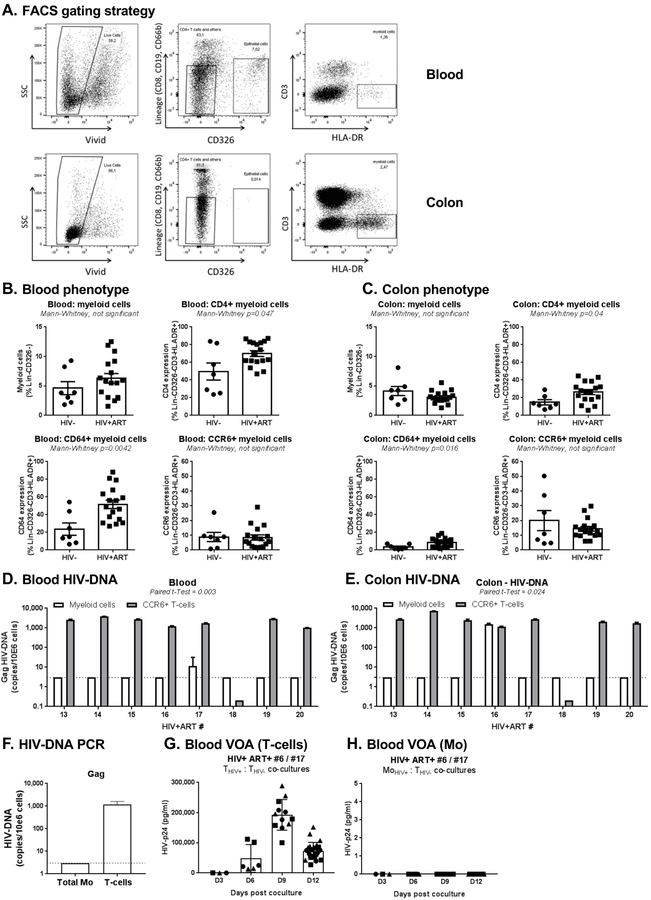
Figure 4. Myeloid cells from blood and colon rarely harbor HIV-DNA in HIV+ART individuals.
Myeloid cells were identified in matched blood and colon biopsies of HIV+ART (n=16) and HIV- (n=7) individuals (cohorts previously described in [53]), using the gating illustrated in panel A. Briefly, live/dead dye (Vivid; Invitrogen) was used to exclude dead cells from analysis. Staining with CD8, CD19, CD66b, and CD326 Abs allowed the exclusion of CD8+ T-cells, B cells, granulocytes and epithelial cells, respectively. Myeloid cells were identified as Lin-CD326-CD3-HLA-DR+. (B-C) Shown is the frequency of total myeloid cells (upper left panel), as well as the expression of CD4 (upper right panel), CD64 (lower left panel) and CCR6 (lower right panel) on myeloid cells from blood (B) vs colon (C) of HIV- vs. HIV+ART individuals. (D-E) Shown are levels of late HIV reverse transcripts (Gag primers) quantified using nested real-time PCR in myeloid cells from blood (D) and colon (E) of n=8 HIV+ART individuals. For comparison, included are levels of Gag HIV-DNA detected by real-time nested PCR in matched CCR6+CD4+ T-cells sorted by FACS, as previously published [53]. (F-H) Frozen PBMC from the HIV+ART#17 participant (Table 1d), with leukapheresis collected at a previous time point (identified as HIV+ART#6 in Table 1a), were used to sort matched CD4+ T-cells and Mo by MACS and FACS, respectively. Shown are Gag HIV-DNA levels in T-cells and Mo ex vivo (F), as well as levels of replication-competent HIV detected in VOA performed with T-cells (G) and Mo (H) from this participant. Bar graphs in G-H indicate mean±SD values or replicate wells, with each symbol representing one replicate value per time point.

