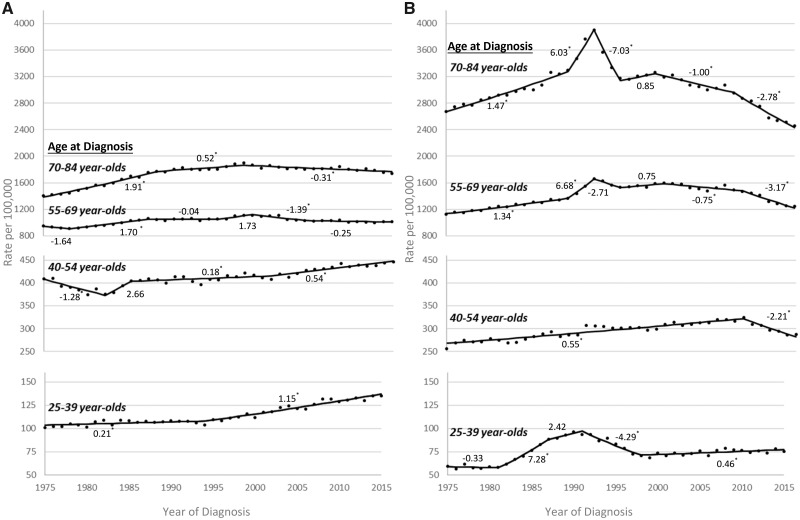
Figure 1.
Trends in overall cancer incidence rates by sex, age group, and year of diagnosis, Surveillance, Epidemiology, and End Results 9 database registries, 1975–2015. A) Annual overall cancer incidence rates, age-adjusted to the 2000 US standard population, and annual percent change (APC) for each joinpoint segment for women by age group at diagnosis. B) Annual overall cancer incidence rates, age-adjusted to the 2000 US standard population, and APC for each joinpoint segment for men by age group at diagnosis. The APC for each joinpoint segment is provided above or below the trend line. *Statistically significant APCs (H0: APC = 0; P < .05 for a two-sided test based on the t distribution).

