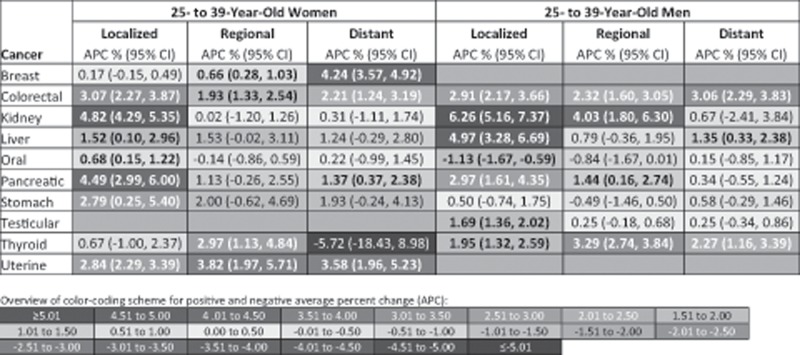
Figure 5.
Site- and stage-specific cancer incidence trends for 25- to 39-year-old women and men based on the annual percent change (APC) after the most recent joinpoint inflection point, Surveillance, Epidemiology, and End Results 9 database registries, 1975–2015. APCs are based on the time trend after the most recent inflection point identified by joinpoint regression using data for all stages combined. Refer to Figures 3 and 4 for the year of the most recent inflection point for each cancer. Incidence rates are age-adjusted to the 2000 US standard population. Cancer types are classified based on SEER’s site recode International Classification of Diseases for Oncology, third revision/World Health Organization-2008 variable: kidney = kidney and renal pelvis; liver = liver and intrahepatic bile duct; oral = oral cavity and pharynx; uterine = corpus and uterus, NOS. Positive APCs, which indicate increasing incidence over time, are in red (color shading darkens with increasing values); negative APCs, which indicate decreasing incidence over time, are in blue. Statistically significant APCs (H0: APC = 0; P < .05 for a two-sided test based on the t distribution) are bold. CI = confidence interval.

