
Extended Data Figure 10 |. Clinical associations of iMM-AGE scores in the Framingham Heart Study dataset.
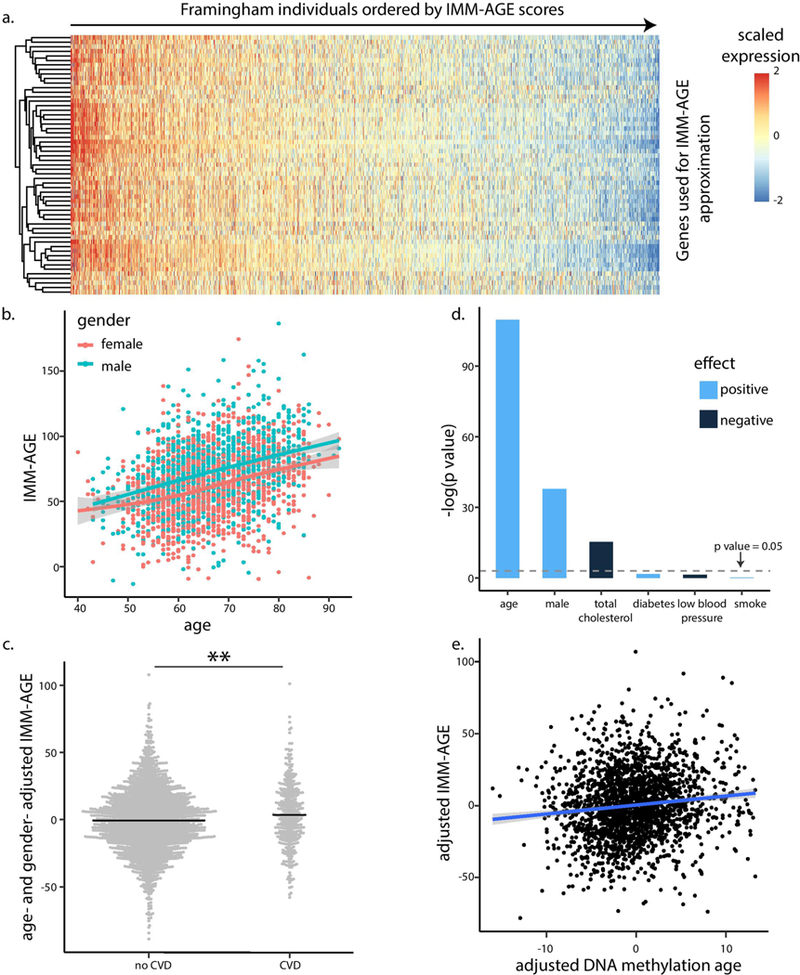
a, Expression levels of genes used for IMM-AGE approximation in gene expression samples of Framingham Heart Study participants ordered by approximated IMM-AGE scores. b, Correlation of estimated IMM-AGE scores with age and gender (linear regression P = 7×10−63 and 7.22 ×10⁻²⁷ (n = 2,292) for age and gender, respectively). Points correspond to individuals; color denotes gender. c, Age- and gender-adjusted IMM-AGE score of individuals stratified based on cardiovascular disease (dots); bold lines denote mean values (P= 0.0023, n = 2,292, two-tailed f-test). d, IMM-AGE score association with cardiovascular risk factors as obtained by linear regression. Bar colors denote positive (light blue) or negative (dark blue) associations. e, Linear regression of IMM-AGE versus DNA methylation age, where both variables were adjusted for cardiovascular risk factors and cardiovascular disease (n = 2,139 individuals). **P<0.01; CVD, cardiovascular disease.