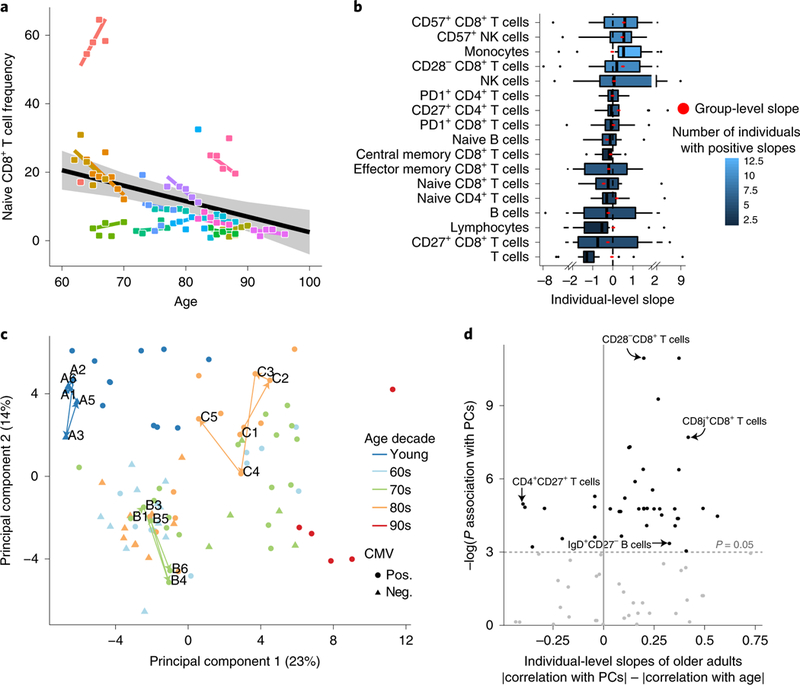
Fig. 2 |. Individuals’ cellular immune profiles exhibit inter-individual variability both at baseline and in their rate of change.

PBMC samples of 18 individuals sampled annually over a 7-year period of the snapshot data set were profiled at high resolution by mass cytometry and manually gated into 73 distinct cell populations. a, Individuals vary in their rate of change of naive CD8+ T cells over time. Shown are the group-level longitudinal regression line (black line, derived from mixed-linear model) and the individual-level lines of each individual (colored by individual). Shaded area denotes confidence interval. b, The frequencies of multiple cell subsets changed at different rates (slopes) among older adults. Boxplots show the distribution of individual- level longitudinal slopes of cell-subset frequencies for 17 immunosenescence-associated cell subsets (n = 15 older adults; boxes represent 25th and 75th percentiles around the median (line); whiskers, 1.5× interquantile range). Group level slopes per cell subset are red dots, whereas boxplot color denotes number of individuals exhibiting a positive individual slope. c, PCA of individuals’ cellular profiles using all cell-subsets’ frequencies. The single time points of an individual are colored by an individual’s age (in decades) at recruitment, with shape denoting CMV serology (pos., positive; neg., negative). Three representative trajectories are shown as bold lines connecting the single time points labeled by visit number and subject identifier and are colored by individual’s decade of age. d, Cell subsets (dots) are scattered by their significance of correlation with the main two principal components (y-axis, P values were calculated using linear regression followed by Fisher’s combination and BH correction, n = 18 individuals) and the difference between the Pearson correlation values of their individual-level slopes calculated either versus individuals’ baseline positions in the PCA space or versus age (x-axis). P value threshold of 0.05 is displayed by a horizontal dashed line.
