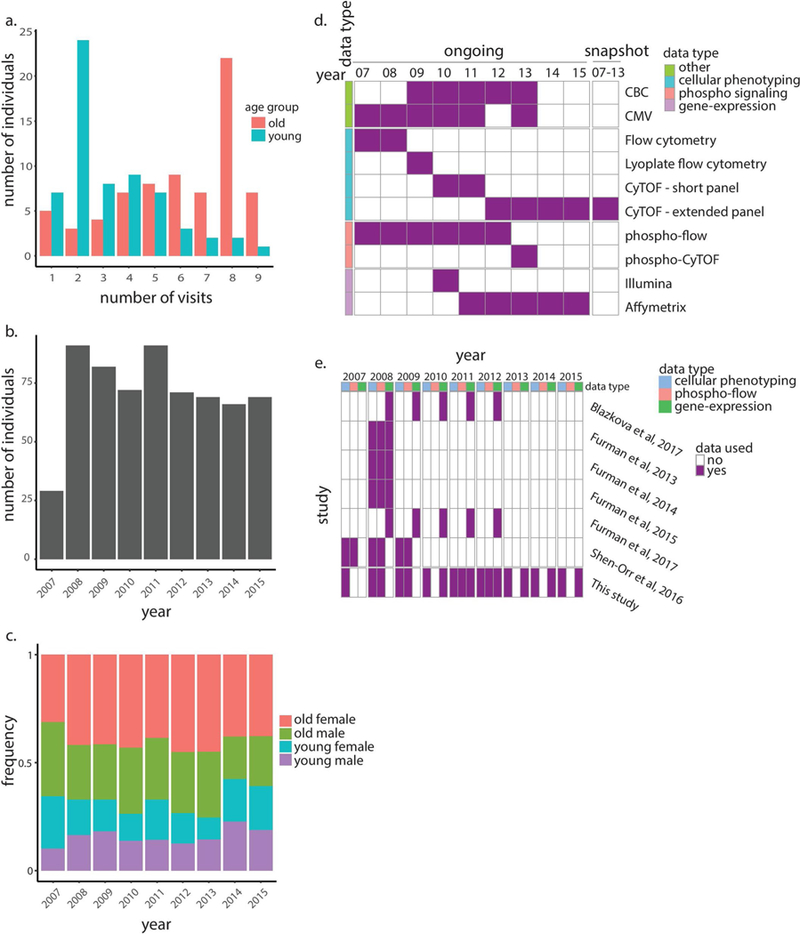
Extended Data Figure 1 |. Study demographics and experimental platforms.

a, Histogram summarizes number of visits (years in which immune profiling was conducted) across individuals stratified by age group. b, Histogram summarizes total number of individuals profiled per year. c, Age and gender distributions of individuals profiled per year. d, Data types and platforms used for immune profiling in each year for snapshot (right column) and ongoing data sets (left columns). e, Data types and relevant years of the Stanford University’s longitudinal study of aging and vaccination that were analyzed in our study (bottom row) and other studies (top rows). CBC, complete blood count.
